Source page: McKinsey & Company
Commentary
Will India get too hot to work?
Sustainability | Asia-Pacific
April 22, 2021 – By 2050, temperatures in some parts of northern India could surpass survivability thresholds for healthy adults. The region has already recorded some of the world’s hottest wet-bulb temperatures—a measurement that combines air temperature and relative humidity.
To read the article, see “Will India get too hot to work?,” November 25, 2020.
customizer here
Visual form
Single-panel thematic heat map.
Layout / body structure
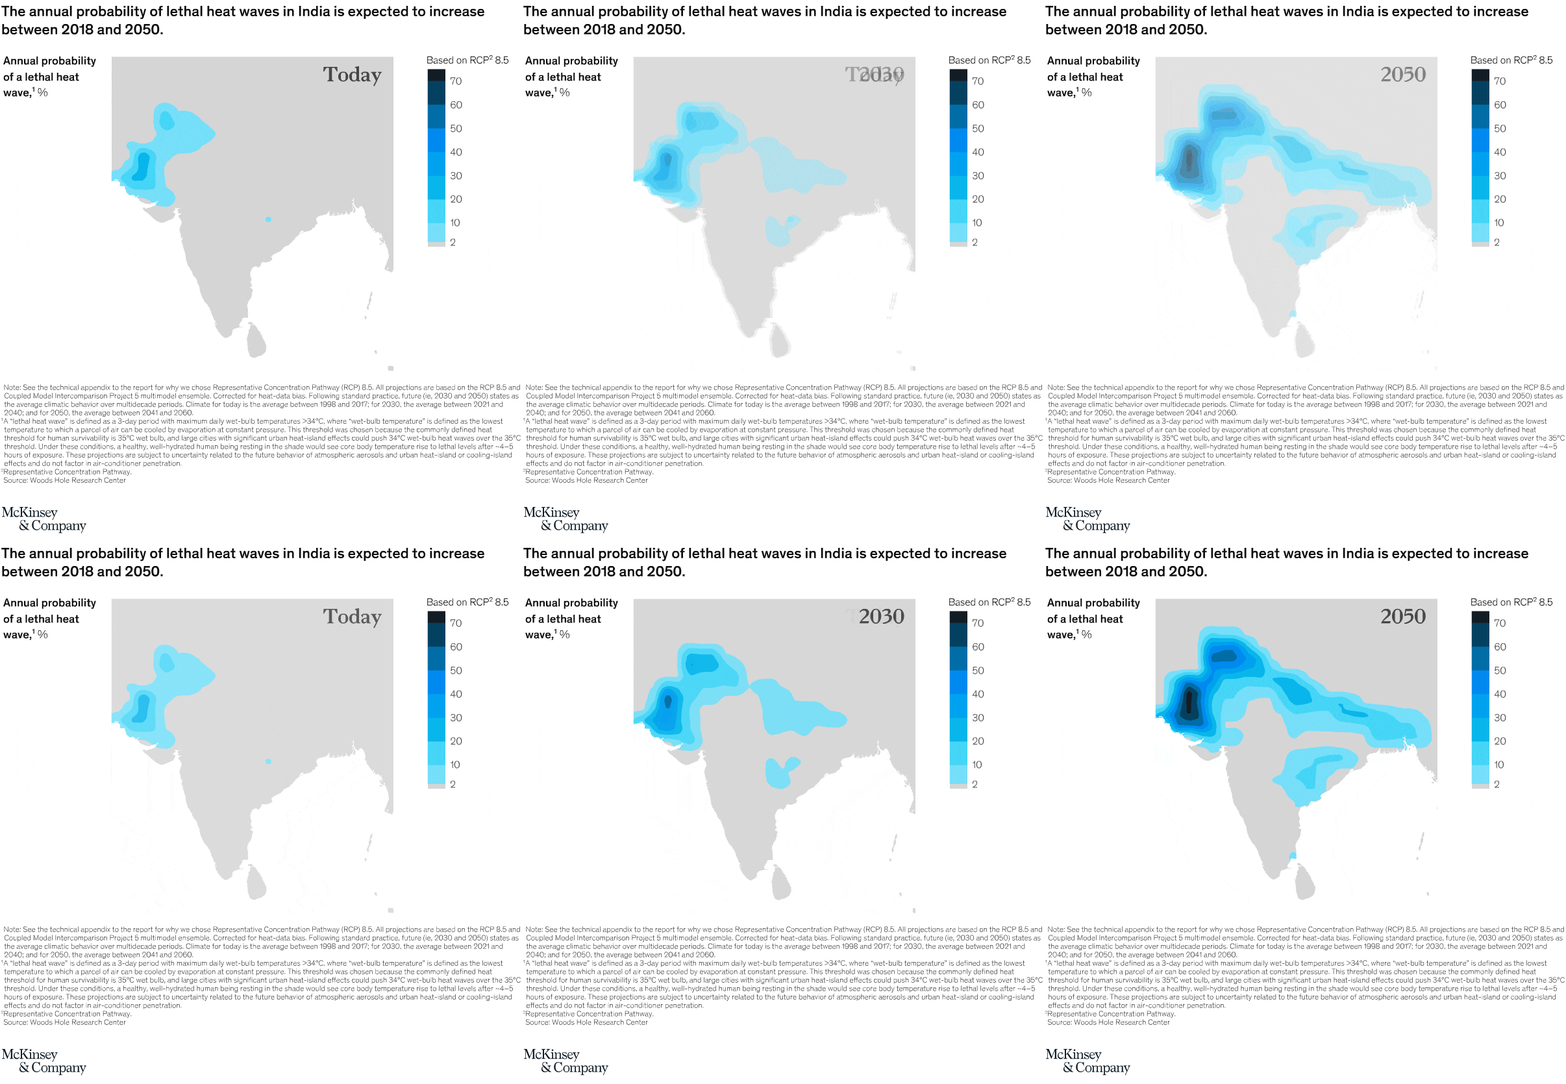
The chart is one map of India filled with layered color bands and accompanied by a vertical legend on the right. Reader looks from the map to the color scale to judge where the darkest zones sit and then reads the large 2050 label to understand the time horizon being shown.
What is being compared
It compares different parts of India by their projected annual probability of a lethal heat wave in 2050.
Measurement system
The measure is annual probability in percent. The legend runs from low single digits up to 70, and darker shades indicate higher projected probability under the RCP 8.5 scenario.
Visible structure inside the graphic
The map uses nested blue bands to show intensity, with the darkest hotspot concentrated in the northwest and lighter bands spreading across northern and eastern stretches of the country. The continuous shading lets the reader see gradients rather than isolated administrative boundaries, which emphasizes the geographic spread of the risk.
Main takeaway from the visual
The probability of lethal heat waves is projected to rise sharply across broad parts of India by 2050, with the most severe exposure concentrated in the northwest and elevated risk extending across a large northern belt. The map makes the hazard look regional and widespread rather than confined to one small pocket.
Key standout values or extremes
The darkest hotspot approaches the top of the legend near 70 percent, while much of the northern and northeastern band sits in midrange blue zones around the teens to 40s. Southern areas are lighter overall, but they still show nontrivial risk rather than an absence of heat exposure.
Controls / sequence, when applicable
This is a static chart image with no in-chart controls to operate.
Companion media, when applicable
There is no separate companion audio or video; the chart image is the full visual on this page.