Source page: McKinsey & Company
Commentary
Capital markets love the mobility industry
Mobility
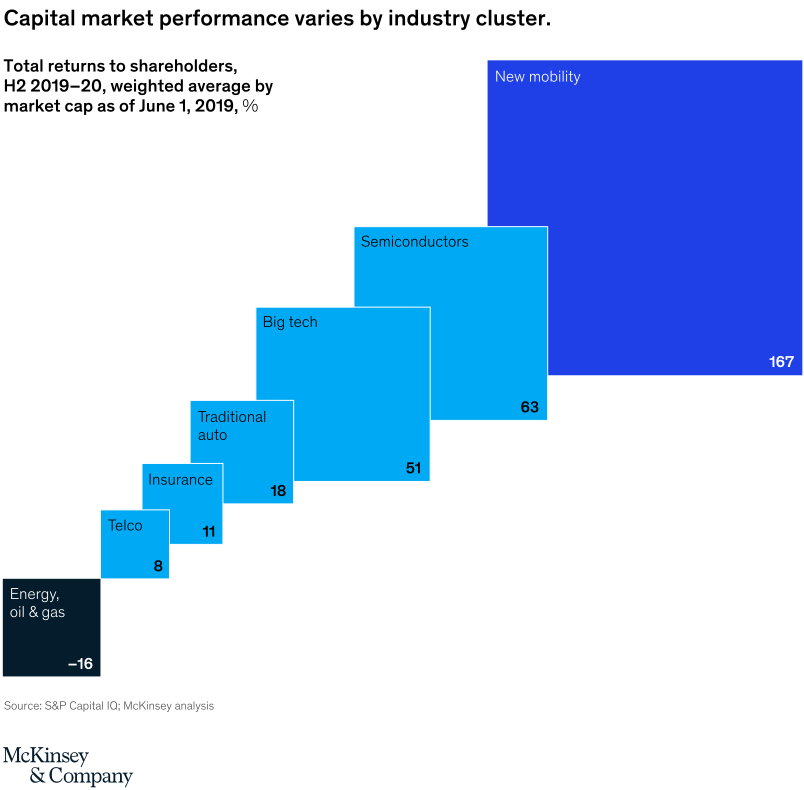
April 12, 2021 – The markets’ favored sectors, such as semiconductors and big tech, have done well over the past year and a half. But mobility has outperformed them all.
To read the article, see “The irresistible momentum behind clean, electric, connected mobility: Four key trends,” April 6, 2021.
customizer here
Visual form
Single-panel stepped block chart.
Layout / body structure
The chart is one ascending sequence of labeled rectangles running from the lower left to the upper right. Reader moves block by block across industry clusters, with each rectangle carrying its own name and total shareholder return.
What is being compared
It compares capital market performance across industry clusters tied to mobility and adjacent sectors, including energy oil and gas, telco, insurance, traditional auto, big tech, semiconductors, and new mobility.
Measurement system
The measure is total return to shareholders from the second half of 2019 through 2020, shown as a market-cap-weighted average as of June 1, 2019. Each block prints its percentage directly, so the comparison comes from both the step position and the labeled value.
Visible structure inside the graphic
Each industry cluster is represented by a solid rectangular block, and the blocks rise like a staircase as returns improve. The smallest and only negative block sits at the lower left, midperformers sit in the center steps, and the dominant new-mobility block occupies a much larger rectangle at the top right.
Main takeaway from the visual
Capital markets rewarded mobility-related growth themes very unevenly, with new mobility, semiconductors, and big tech far ahead of traditional auto and legacy sectors. The step-up structure makes the performance ladder feel steep rather than incremental.
Key standout values or extremes
Energy, oil and gas is the lone negative at minus 16 percent, while telco is 8, insurance 11, traditional auto 18, big tech 51, semiconductors 63, and new mobility 167. The jump from semiconductors to new mobility is especially dramatic because the final block is both the tallest and the largest on the page.
Controls / sequence, when applicable
This is a static chart image with no in-chart controls to operate.
Companion media, when applicable
There is no separate companion audio or video; the chart image is the full visual on this page.