Source page: McKinsey & Company
Commentary
Vaccination programs plunge ahead
COVID-19 | Public Health
April 8, 2021 – COVID-19 vaccine stocks are building in the EU, UK, and US. The US will likely soon have sufficient supplies for all adults; the others are not far behind.
To read the article, see “When will the COVID-19 pandemic end?,” March 26, 2021.
customizer here
Visual form
Three-series line chart.
Layout / body structure
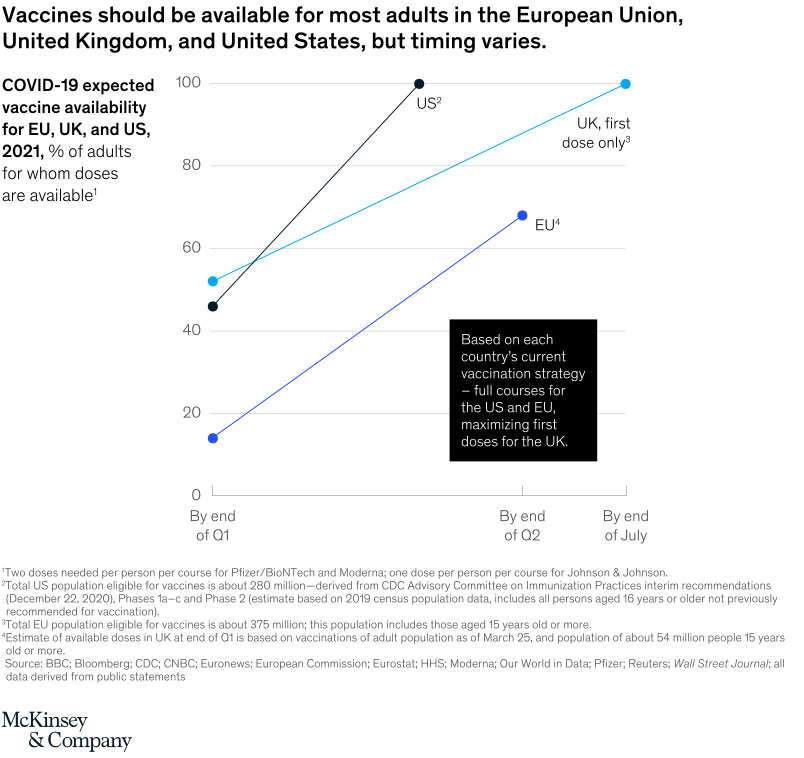
The chart is one line chart with time running from the end of Q1 to the end of Q2 and the end of July. Reader follows three separate country trajectories across the shared timeline to compare how quickly vaccine availability is expected to reach most adults.
What is being compared
It compares expected COVID-19 vaccine availability for adults in the European Union, the United Kingdom, and the United States during 2021.
Measurement system
The measure is percent of adults for whom doses are available. Each country is shown as a line with marked endpoints, and the vertical position of each marker indicates the availability level reached by each date.
Visible structure inside the graphic
The US, UK, and EU each have a distinct colored trajectory, and the chart uses only a few key points rather than dense monthly observations. A black note box in the lower-right portion explains that the definitions differ slightly because the UK line refers to first dose only while the US and EU refer to full courses.
Main takeaway from the visual
Vaccines are expected to become available for most adults across all three regions, but the timing differs markedly. The US rises fastest toward full availability, the UK reaches full coverage later under a first-dose strategy, and the EU trails both by the end of Q2.
Key standout values or extremes
At the end of Q1, the chart shows roughly 46 percent for the US, 52 percent for the UK first-dose path, and about 14 percent for the EU. The US reaches 100 percent by the end of Q2, the UK reaches 100 percent by the end of July, and the EU rises to about 68 percent by the end of Q2.
Controls / sequence, when applicable
This is a static chart image with no in-chart controls to operate.
Companion media, when applicable
There is no separate companion audio or video; the chart image is the full visual on this page.