Source page: McKinsey & Company
Commentary
Build that bridge: How top IT companies connect businesses and tech teams
Digital | Strategy
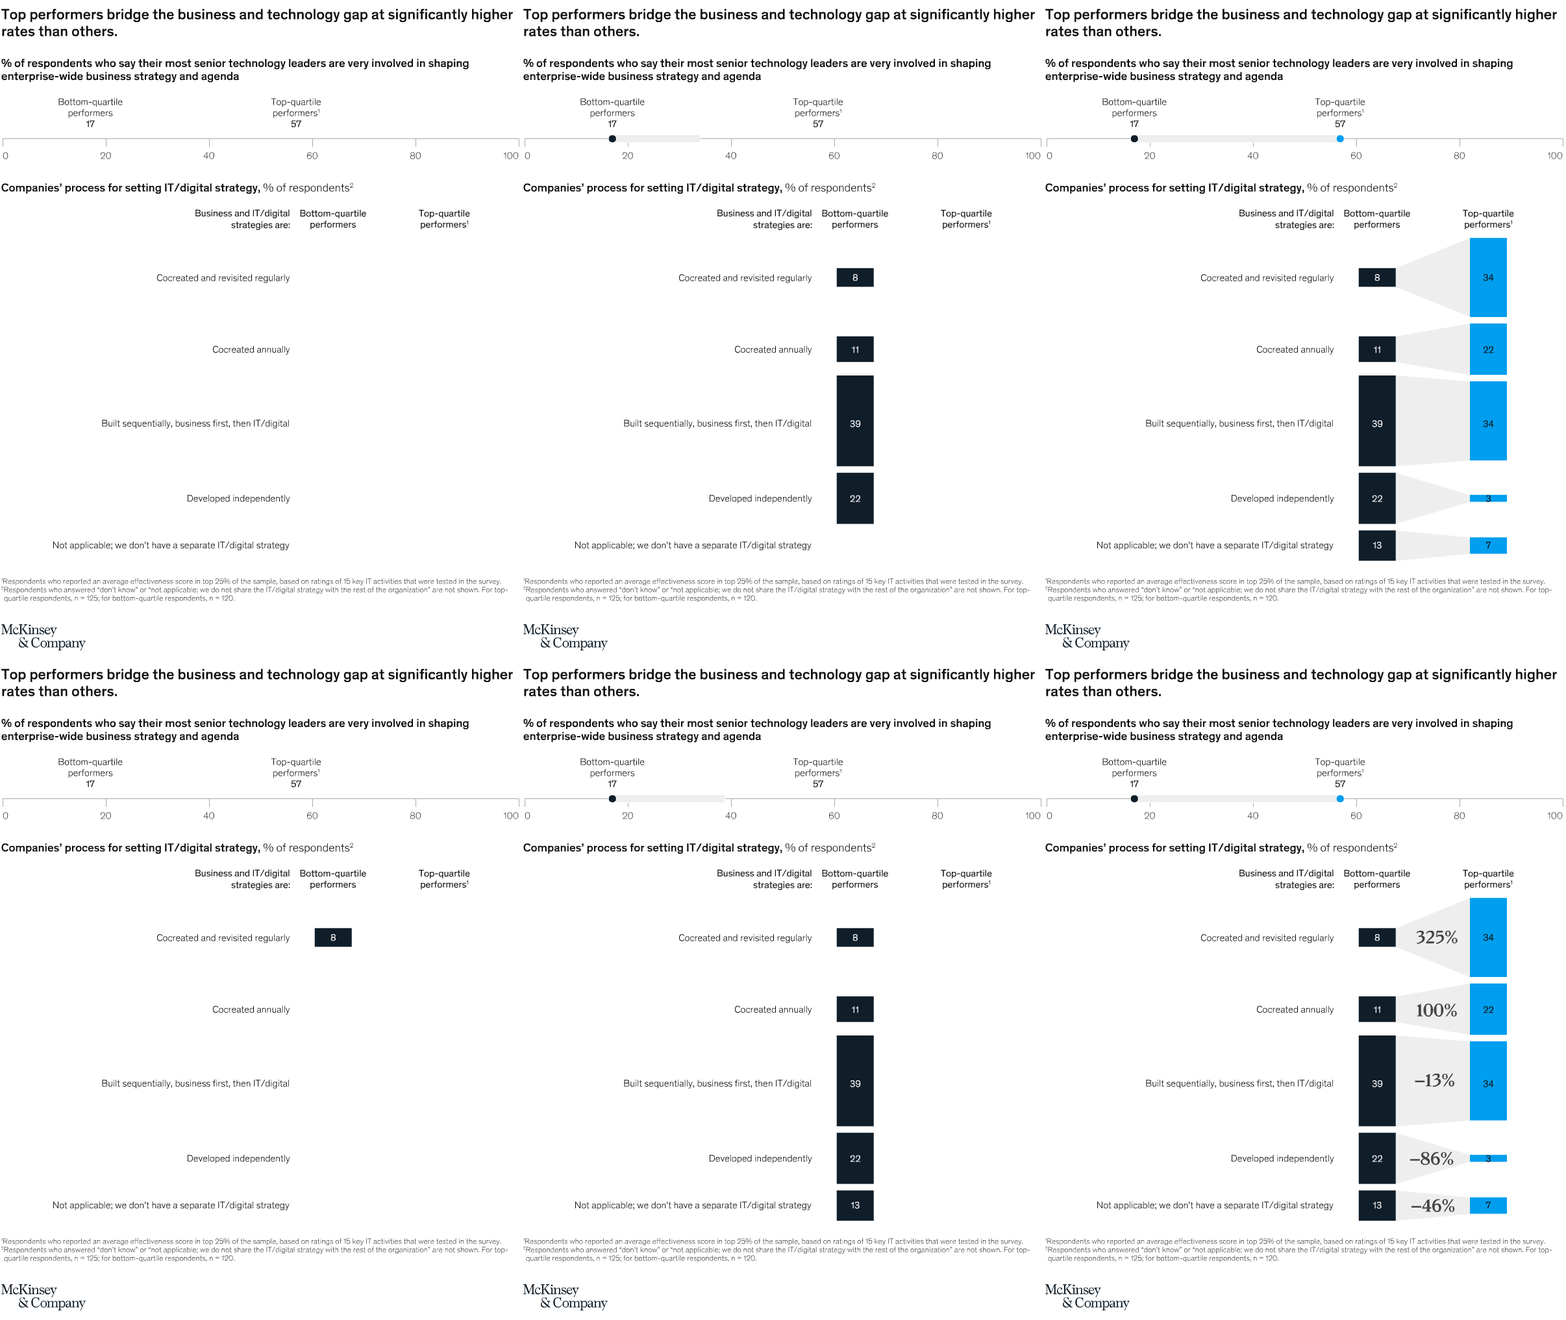
April 7, 2021 – In our latest McKinsey Global Survey on technology strategy, top performers revealed the practices that build bridges between technology and business units. CXOs, please step forward: 57 percent of respondents say their senior leaders are very involved in strategic planning, versus 17 percent in the bottom quartile.
To read the survey, see “Seven lessons on how technology transformations can deliver value,” March 11, 2021.
customizer here
Visual form
Two-part comparison chart combining a horizontal benchmark strip and diverging bar comparisons.
Layout / body structure
The chart begins with a short top strip that compares bottom-quartile and top-quartile performers on the share saying senior technology leaders are very involved in shaping enterprise-wide business strategy. Below that, a larger panel compares five different IT and digital strategy processes, with bottom-quartile figures on the left, top-quartile figures on the right, and a large percentage-change bridge in the middle.
What is being compared
It compares lower-performing and top-performing companies on executive technology involvement and on how business and IT or digital strategies are set. The lower panel covers strategies cocreated and revisited regularly, cocreated annually, built sequentially with business first, developed independently, and having no separate IT or digital strategy.
Measurement system
The measure throughout is percent of respondents. The top strip prints 17 percent for bottom-quartile performers and 57 percent for top-quartile performers, and the lower panel prints paired left-right values plus the percentage difference between the groups for each strategy process.
Visible structure inside the graphic
The top strip uses two labeled markers on a 0 to 100 line, while the lower panel uses repeated horizontal comparison shapes that flare or narrow between left and right values. Blue bars on the right represent top-quartile performers, dark bars on the left represent bottom-quartile performers, and the gray bridge in between makes the direction and size of the gap easy to read row by row.
Main takeaway from the visual
Top performers connect business and technology leadership much more tightly than bottom-quartile companies do, especially when strategy is cocreated rather than handled sequentially or independently. The biggest visual gains appear in the cocreated rows, while the independently developed and no-separate-strategy rows collapse sharply for top performers.
Key standout values or extremes
Senior technology-leader involvement rises from 17 percent in bottom-quartile performers to 57 percent in top-quartile performers. In the process panel, cocreated and revisited regularly moves from 8 to 34, a 325 percent increase; cocreated annually rises from 11 to 22, a 100 percent increase; sequential business-first drops from 39 to 34; developed independently falls from 22 to 3, an 86 percent decline; and having no separate IT or digital strategy drops from 13 to 7, down 46 percent.
Controls / sequence, when applicable
This is a static chart image with no in-chart controls to operate.
Companion media, when applicable
There is no separate companion audio or video; the chart image is the full visual on this page.