Source page: McKinsey & Company
Commentary
Seven keys to herd immunity
COVID-19 | Public Health
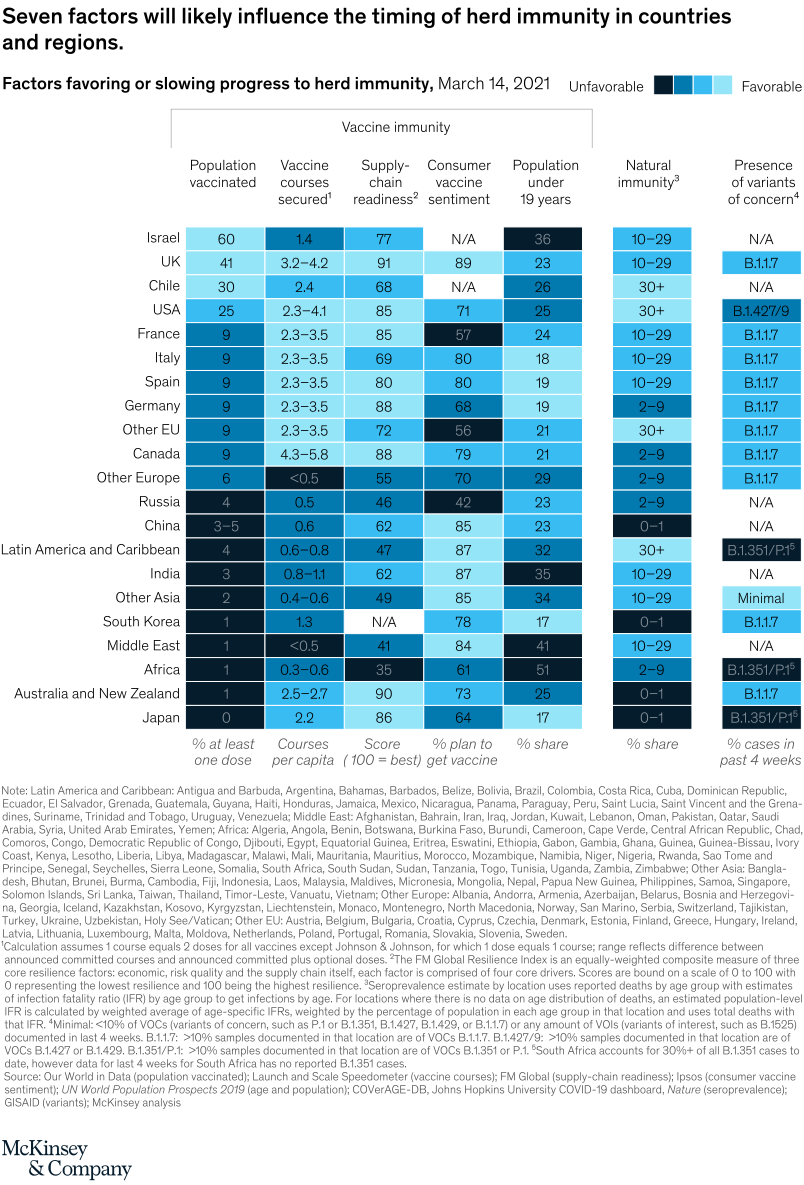
March 30, 2021 – It’s not very often that humanity has a common goal. Herd immunity is one such example. In this heatmap, we sketch the world’s progress toward the day when COVID-19 can’t readily spread.
To read the article, see “When will the COVID-19 pandemic end?,” March 26, 2021.
customizer here
Visual form
Multi-factor heatmap matrix.
Layout / body structure
The chart is a wide matrix with countries and regions listed down the left and seven herd-immunity factors arranged as columns across the top. Reader moves left to right within a row to see a location’s profile, then compares down each column to see which factors are strongest or weakest across the full set of geographies.
What is being compared
It compares countries and regions on seven factors that may favor or slow progress toward herd immunity: population vaccinated, vaccine courses secured, supply-chain readiness, consumer vaccine sentiment, population under 19 years, natural immunity, and the presence of variants of concern.
Measurement system
Most columns use percentages or indexed scores printed directly in each cell, while the variants column uses labeled strain categories. Color intensity runs from unfavorable to favorable across the first six factor columns, letting the reader judge both the numeric value and its relative strength at the same time.
Visible structure inside the graphic
Each row becomes a full herd-immunity profile, with darker and lighter blue cells forming a visual stripe across the seven factors. The matrix includes a bracketed heading for vaccine immunity over the first five columns and then separate columns for natural immunity and variants, which helps organize the table into related clusters of drivers.
Main takeaway from the visual
The timing of herd immunity depends on a bundle of factors rather than on vaccination alone, and different countries show very different combinations of strengths and constraints. The matrix makes that clear because no row dominates every column; instead, each geography shows a mixed pattern of favorable and unfavorable cells.
Key standout values or extremes
Israel sits highest on population vaccinated at 60 percent, while the UK combines 41 vaccinated, 3.2 to 4.2 courses secured per capita, and a 91 supply-readiness score. The US shows 25 vaccinated with strong supply readiness at 85, China has very high consumer sentiment at 85 but low vaccination and a 0 to 1 natural-immunity band, and Japan sits at 0 vaccinated in this snapshot despite 2.2 courses per capita and an 86 readiness score.
Controls / sequence, when applicable
This is a static chart image with no in-chart controls to operate.
Companion media, when applicable
There is no separate companion audio or video; the chart image is the full visual on this page.