Source page: McKinsey & Company
Commentary
Top IT performers are all in on digital
Digital | Strategy
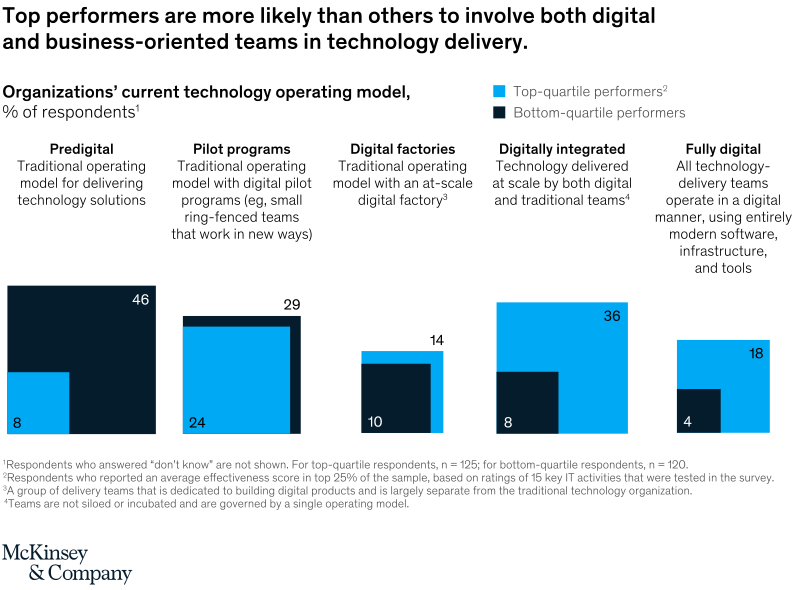
March 29, 2021 – Top-quartile respondents are more than four times likelier than bottom-quartile peers to have a digitally integrated or fully digital operating model, in which both digital and business-oriented teams deliver technology. That’s one of several insights from our latest McKinsey Global Survey on technology strategy.
To read the survey, see “Seven lessons on how technology transformations can deliver value,” March 11, 2021.
customizer here
Visual form
Five-category grouped bar comparison chart.
Layout / body structure
The chart lays out five operating-model categories from left to right: predigital, pilot programs, digital factories, digitally integrated, and fully digital. Within each category, the chart pairs a light-blue bar for top-quartile performers with a dark bar for bottom-quartile performers.
What is being compared
It compares organizations’ current technology operating models for top-quartile performers versus bottom-quartile performers. The categories range from traditional predigital delivery to fully digital operating models.
Measurement system
The measure is percent of respondents. Each paired bar prints its value directly, allowing the reader to compare the two performance groups within each operating-model category.
Visible structure inside the graphic
The five categories use the same side-by-side bar structure, which makes the contrast between the two groups easy to read at a glance. The darker bars dominate on the left side of the maturity ladder, while the lighter bars become taller in the more advanced digital categories on the right.
Main takeaway from the visual
Top performers are much more concentrated in digitally integrated and fully digital operating models, while bottom-quartile performers remain much more likely to be predigital. The chart makes the maturity gap visible because the bar advantage flips as the categories move from legacy to advanced models.
Key standout values or extremes
Predigital is 46 percent for bottom-quartile performers versus 8 percent for top-quartile performers. Digitally integrated is 36 versus 8 in favor of top performers, fully digital is 18 versus 4, pilot programs is 24 versus 29 with the groups close together, and digital factories is 14 versus 10.
Controls / sequence, when applicable
This is a static chart image with no in-chart controls to operate.
Companion media, when applicable
There is no separate companion audio or video; the chart image is the full visual on this page.