Source page: McKinsey & Company
Commentary
We’ll always have Paris—as a goal
Carbon pricing | Climate change
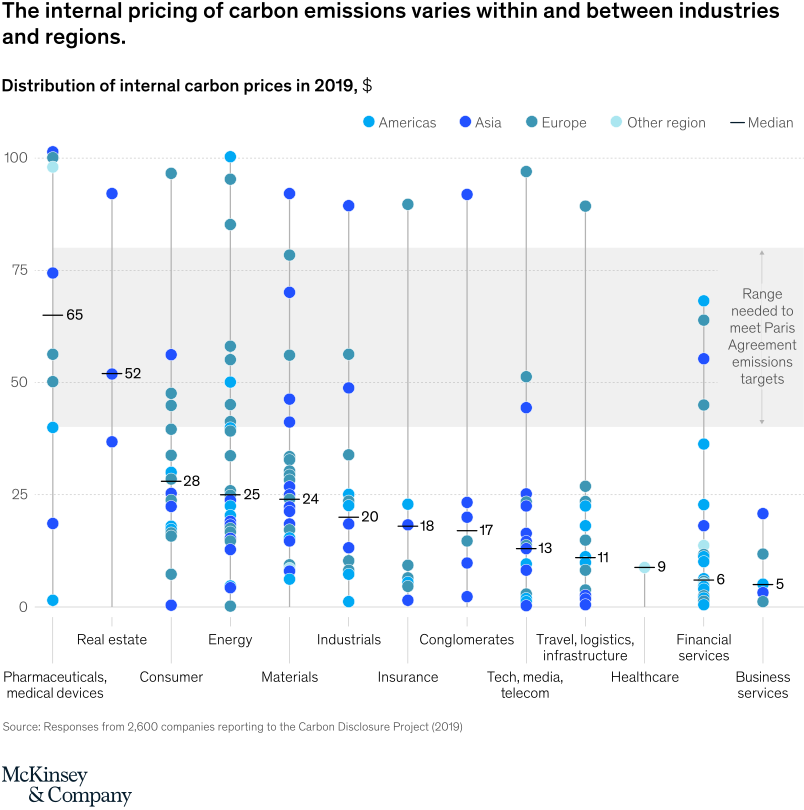
March 23, 2021 – With no formal, defined global standards to price their carbon emissions, many companies are selecting values that are most useful within their own business contexts and regions—even if they are considerably lower than what’s needed to meet Paris Agreement targets.
To read the article, see “The state of internal carbon pricing,” February 10, 2021.
customizer here
Visual form
Industry-by-region dot distribution chart.
Layout / body structure
The chart is one wide plot with industry groups arranged left to right and many colored dots stacked vertically within each industry. Reader scans within each industry to see the spread of internal carbon prices, then compares the median marker and the broader distribution across industries and regions.
What is being compared
It compares the distribution of internal carbon prices in 2019 across industries and regions, including pharmaceuticals and medical devices, real estate, consumer, energy, materials, industrials, insurance, conglomerates, tech media telecom, travel logistics and infrastructure, healthcare, financial services, and business services.
Measurement system
The vertical scale is dollars, and each dot represents a reported internal carbon price colored by region. Small horizontal tick labels mark the median for each industry, and a shaded horizontal band indicates the rough range needed to meet Paris Agreement emissions targets.
Visible structure inside the graphic
Each industry forms a vertical cloud of dots with long whisker-like ranges reaching from low outliers to occasional very high prices. The colored dots distinguish Americas, Asia, Europe, and other regions, while the median markers sit near the lower middle of most clusters, making the gap between typical practice and the Paris target band easy to see.
Main takeaway from the visual
Internal carbon prices vary widely within and across industries, and typical prices often sit below the range associated with Paris-aligned targets. The plot makes this visible because many medians cluster in the teens or twenties even while the shaded Paris range sits much higher.
Key standout values or extremes
Median prices range from about 5 dollars in business services to 28 in consumer, with real estate around 52, pharmaceuticals and medical devices around 65, and energy around 25. Several industries show individual observations near or above 100 dollars, but most dots and medians remain well below the shaded Paris-target band around the 40 to 80 dollar region.
Controls / sequence, when applicable
This is a static chart image with no in-chart controls to operate.
Companion media, when applicable
There is no separate companion audio or video; the chart image is the full visual on this page.