Source page: McKinsey & Company
Commentary
Every which way: Leading companies exploit all four avenues of growth
COVID-19 | Strategy
March 19, 2021 – The end of the COVID-19 crisis feels tantalizingly close, in some countries. But will companies be ready to shift into high gear? Our research shows that in recent years, the fastest growing companies have expanded in every direction.
To read the podcast transcript, see “In conversation: The COVID-Exit,” March 9, 2021.
customizer here
Visual form
Nested-square comparison chart.
Layout / body structure
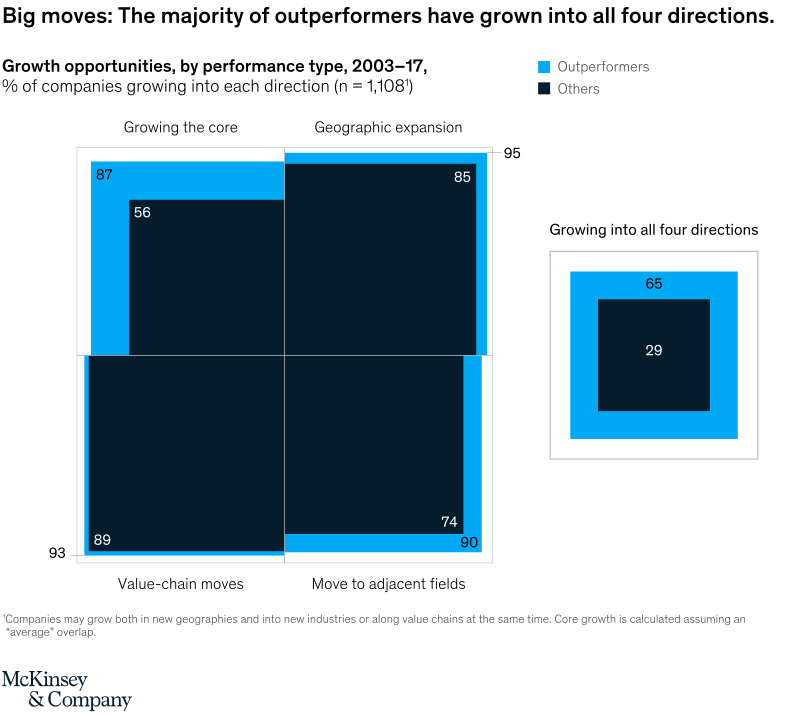
The chart is organized around a large square divided into four growth directions and a smaller inset square to the right that summarizes companies growing in all four directions at once. Reader first compares the four labeled quadrants around the main square and then looks to the inset as the combined-outcome summary.
What is being compared
It compares outperformers with other companies on the share growing into four directions: growing the core, geographic expansion, value-chain moves, and moving to adjacent fields. The inset then compares the share growing into all four directions simultaneously.
Measurement system
The measure is percent of companies growing into each direction. Each quadrant prints one value for outperformers and one for others, and the inset square does the same for the all-four-directions outcome.
Visible structure inside the graphic
The main shape uses blue outer blocks for outperformers and a darker inner block for others, so the size difference is visible in every direction. The separate inset square on the right isolates the most demanding growth outcome, making the gap between the two groups even more striking than in the four single-direction comparisons.
Main takeaway from the visual
Outperformers are more likely than other companies to pursue growth in every direction shown, and the biggest separation appears when all four avenues are combined. The nested-square design makes outperformers look consistently larger across every dimension rather than advantaged in only one direction.
Key standout values or extremes
Outperformers versus others are 87 to 56 for growing the core, 95 to 85 for geographic expansion, 93 to 89 for value-chain moves, and 90 to 74 for moving to adjacent fields. In the inset, 65 percent of outperformers versus 29 percent of others are shown growing into all four directions.
Controls / sequence, when applicable
This is a static chart image with no in-chart controls to operate.
Companion media, when applicable
There is no separate companion audio or video; the chart image is the full visual on this page.