Source page: McKinsey & Company
Commentary
Black actors get fewer chances to break out
Diversity & Inclusion | Entertainment
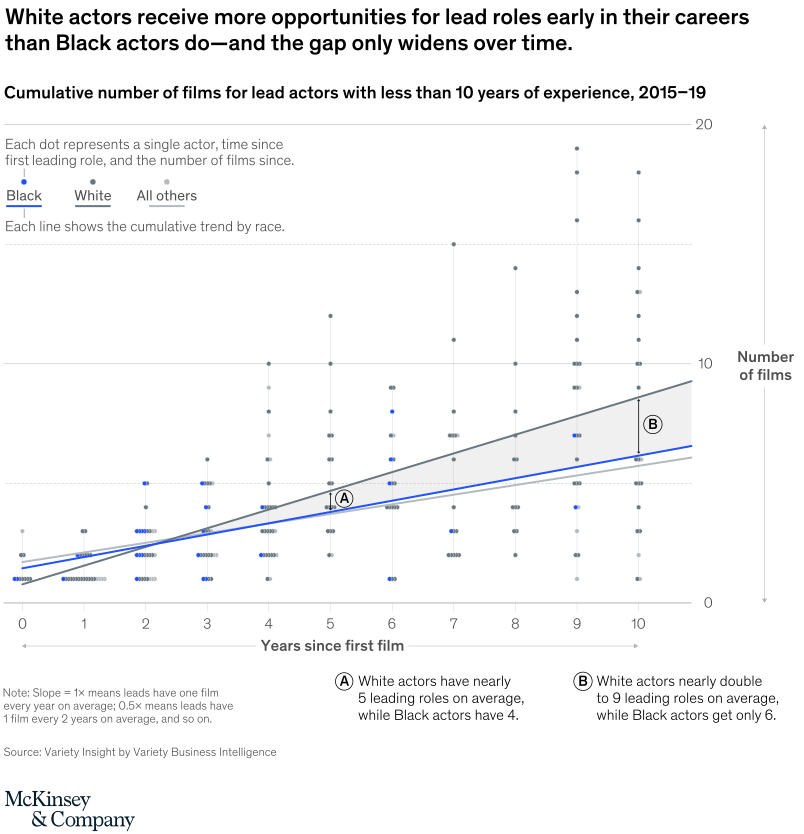
March 18, 2021 – Emerging Black actors get an average of six leading roles in the first decade of their career, compared with their white counterparts’ nine. Fewer opportunities also translate to less consistent income and thus less viability and incentive to stay in the industry.
To read the article, see “Black representation in film and TV: The challenges and impact of increasing diversity,” March 11, 2021.
customizer here
Visual form
Scatter-with-trend comparison chart.
Layout / body structure
The chart is one scatter plot with years since first film on the horizontal axis and number of films on the vertical axis, overlaid with cumulative trend lines by race. Reader scans the cloud of points first and then uses the blue and gray trend lines plus the A and B callouts to read the widening gap over time.
What is being compared
It compares cumulative film opportunities for Black and White lead actors with less than 10 years of experience. The plot shows how the number of films accumulates as careers progress and how the racial gap changes over time.
Measurement system
The horizontal scale measures years since first film, and the vertical scale measures cumulative number of films. Individual dots represent actors, and the trend lines summarize the average path for Black versus White actors over the first decade of a career.
Visible structure inside the graphic
Blue points and a blue trend line represent Black actors, while gray points and a gray trend line represent White actors. The divergence becomes more apparent toward the right side of the chart, where the gray line climbs more steeply and the annotated callouts quantify the widening difference at about five and nine years.
Main takeaway from the visual
White actors receive more lead-role opportunities early in their careers, and the gap widens rather than closes as experience accumulates. The spread between the two trend lines becomes larger over time, so the chart reads as cumulative disadvantage rather than a one-time difference.
Key standout values or extremes
The callout near five years says White actors have nearly 5 leading roles on average while Black actors have 4. By about nine years, the second callout shows White actors nearing 9 leading roles on average while Black actors get only 6, making the later-career gap noticeably larger.
Controls / sequence, when applicable
This is a static chart image with no in-chart controls to operate.
Companion media, when applicable
There is no separate companion audio or video; the chart image is the full visual on this page.