Source page: McKinsey & Company
Commentary
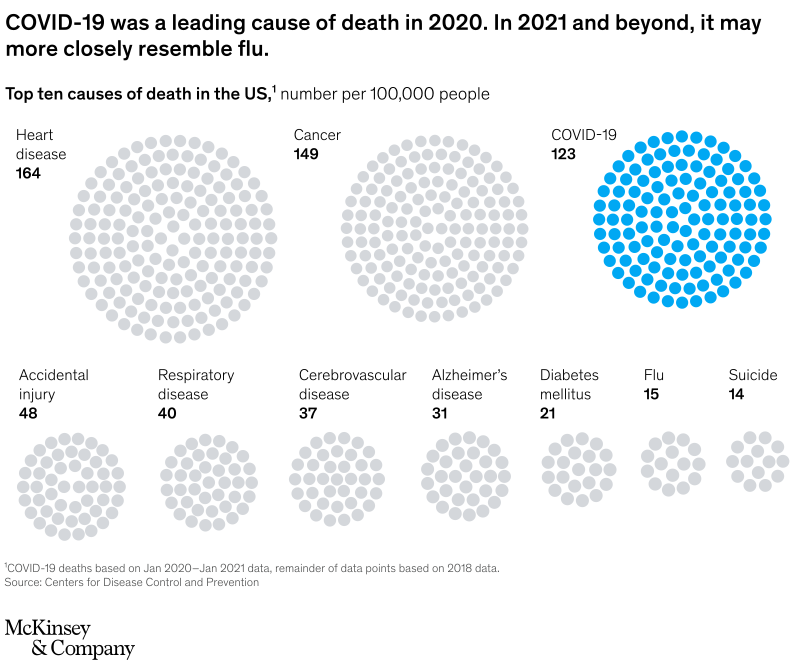
In 2020, COVID-19 deaths were 8 times greater than a typical flu season
COVID-19 | Public Health | North America
March 10, 2021 – COVID-19 was America’s third leading cause of death in 2020. It’s almost as if a new plague-like cancer descended on the nation. In 2021, the grim math should improve. #America2021
To read the article, see “America 2021: Building a bridge to normalcy,” February 15, 2021.
customizer here
Visual form
Scaled dot-pack cause-of-death comparison chart.
Layout / body structure
The chart is laid out as a single ranking field of ten circular dot packs, with the three largest causes across the top and the remaining causes stepping down in size along the bottom row. Reader scans from the large top circles to the smaller lower circles to compare how COVID-19 fit into the overall mortality picture in 2020.
What is being compared
It compares the top ten causes of death in the United States in 2020, including heart disease, cancer, COVID-19, accidental injury, respiratory disease, cerebrovascular disease, Alzheimer’s disease, diabetes mellitus, flu, and suicide.
Measurement system
The measure is number of deaths per 100,000 people. Each cause is represented by a dot-packed circle scaled to its mortality rate, and the exact value is printed next to the cause label.
Visible structure inside the graphic
Heart disease and cancer appear as the two largest gray circles, while COVID-19 is the only large circle colored blue, which makes its ranking stand out immediately. The remaining causes shrink progressively across the lower row, with flu and suicide reduced to much smaller dot packs at the far right.
Main takeaway from the visual
COVID-19 was not a marginal add-on to the 2020 mortality picture; it sat among the leading causes of death. The blue COVID-19 circle is only smaller than heart disease and cancer and is vastly larger than the flu circle, which makes the gap visually unmistakable.
Key standout values or extremes
Heart disease leads at 164 deaths per 100,000 and cancer follows at 149, while COVID-19 is third at 123. By contrast, accidental injury is 48, respiratory disease 40, cerebrovascular disease 37, Alzheimer’s disease 31, diabetes mellitus 21, flu 15, and suicide 14, so COVID-19 stands at more than eight times the flu rate shown here.
Controls / sequence, when applicable
This is a static chart image with no in-chart controls to operate.
Companion media, when applicable
There is no separate companion audio or video; the chart image is the full visual on this page.