Source page: McKinsey & Company
Commentary
Great migrations: How economic mobility can ease racial inequity
Diversity & Inclusion | Economics | North America
March 9, 2021 – America’s leaders can reduce workforce inequities by helping people of color get to where the jobs are. Ten growth hubs hold the highest potential for Black workers. #America2021
To read the article, see “America 2021: The opportunity to advance racial equity,” February 17, 2021.
customizer here
Visual form
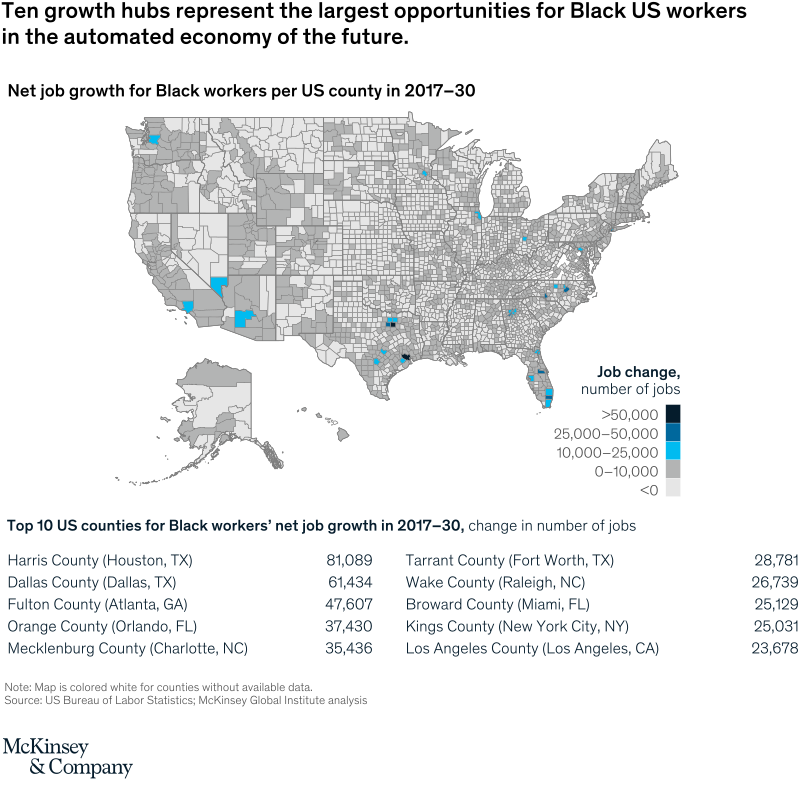
County-level US choropleth map with ranked county table.
Layout / body structure
The chart places a full US county map at the top, with Alaska inset below and a legend on the right, then follows with a two-column list of the top ten counties for Black workers’ net job growth. Reader takes in the national geographic pattern first and then uses the county table to identify the largest individual growth hubs by name and value.
What is being compared
It compares projected net job growth for Black workers by US county from 2017 to 2030 and highlights the counties expected to create the largest absolute number of jobs.
Measurement system
The measure is change in number of jobs. Counties are shaded into five bins: greater than 50,000, 25,000 to 50,000, 10,000 to 25,000, 0 to 10,000, and less than 0, with white counties marking locations without available data.
Visible structure inside the graphic
Most counties are shown in grays, while the strongest growth hubs pop in progressively darker blues, making the biggest opportunity clusters stand out on the map. The bottom table then names the ten leading counties and prints their job-growth totals, which anchors the geography in exact metro-level numbers.
Main takeaway from the visual
The biggest future job gains for Black workers are concentrated in a limited set of growth hubs rather than spread evenly across the country. The darkest and medium-blue counties cluster around major Sun Belt and large metro areas, reinforcing the idea that mobility toward specific hubs could matter more than broad national averages.
Key standout values or extremes
Harris County, Texas leads with 81,089 projected jobs, followed by Dallas County at 61,434 and Fulton County, Georgia at 47,607. Orange County, Florida shows 37,430 and Mecklenburg County, North Carolina 35,436, while Tarrant County, Texas has 28,781, Wake County, North Carolina 26,739, Broward County, Florida 25,129, Kings County, New York 25,031, and Los Angeles County 23,678.
Controls / sequence, when applicable
This is a static chart image with no in-chart controls to operate.
Companion media, when applicable
There is no separate companion audio or video; the chart image is the full visual on this page.