Source page: McKinsey & Company
Commentary
Across the public sector, operations and risk management could benefit greatly from a shift to the cloud
Public Sector | Digital
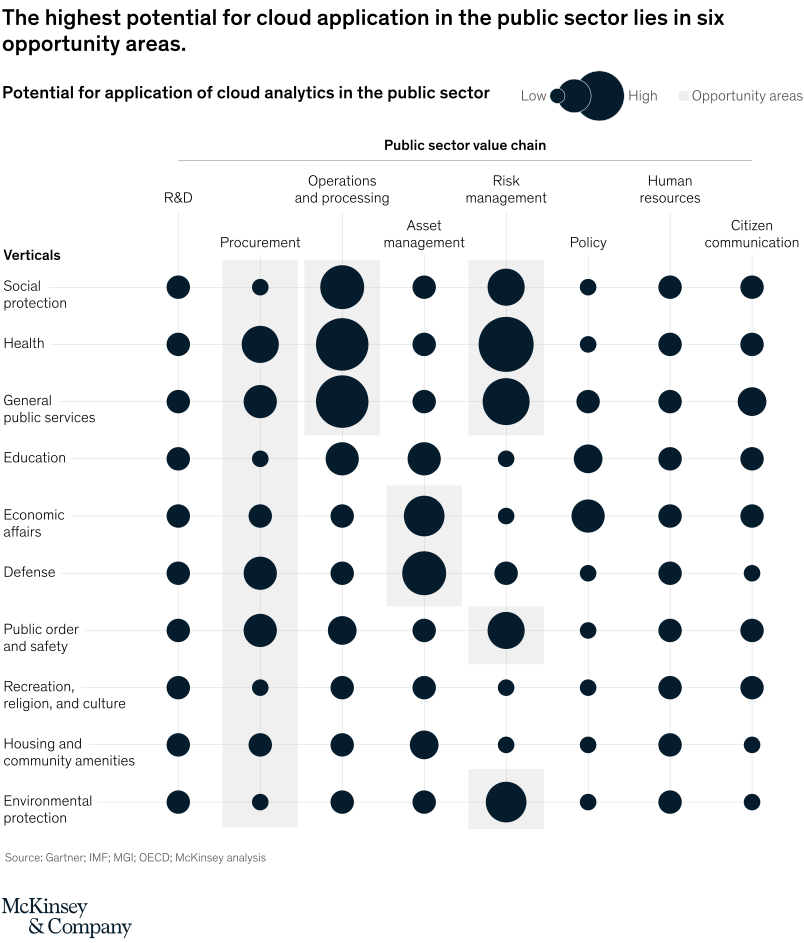
February 12, 2021 – This heat map shows cloud-based transformation potential within different government functions and highlights six potential high-impact areas—among them health, general public services, and environmental protection.
To read the article, see “Ahead in the cloud: Transforming public-sector performance,” February 10, 2021.
customizer here
Visual form
Bubble-matrix opportunity chart.
Layout / body structure
The chart is a grid with public-sector verticals running down the left side and public-sector value-chain functions running across the top. Reader scans across each row or down each column, using bubble size and the lightly shaded opportunity-area columns to spot where cloud application potential is largest.
What is being compared
It compares the potential for application of cloud analytics across ten public-sector verticals and eight value-chain functions, including R and D, procurement, operations and processing, asset management, risk management, policy, human resources, and citizen communication.
Measurement system
The measure is qualitative potential encoded by bubble size. Small bubbles indicate low potential and large bubbles indicate high potential, with the legend at the top right showing the size scale and the shaded columns marking the named opportunity areas.
Visible structure inside the graphic
Every cell in the matrix contains a single dark bubble, so the comparison depends on relative circle size rather than on bar length. The largest clusters appear repeatedly in operations and processing, risk management, and asset management, and the light-gray bands behind several columns visually emphasize those opportunity zones across multiple sectors.
Main takeaway from the visual
The biggest cloud-analytics opportunities in the public sector are concentrated in a handful of functions rather than spread evenly everywhere. Operations and processing and risk management stand out across many verticals, while some functions such as policy or citizen communication show mostly smaller bubbles.
Key standout values or extremes
The largest bubbles on the page appear in operations and processing for health and general public services, in risk management for health and general public services, and in asset management for economic affairs and defense. By contrast, many policy, human-resources, and citizen-communication cells stay comparatively small, signaling lower potential in those areas for most verticals.
Controls / sequence, when applicable
This is a static chart image with no in-chart controls to operate.
Companion media, when applicable
There is no separate companion audio or video; the chart image is the full visual on this page.