Source page: McKinsey & Company
Commentary
High-risk Americans could all be vaccinated by mid-2021
COVID-19 | Public Health | North America
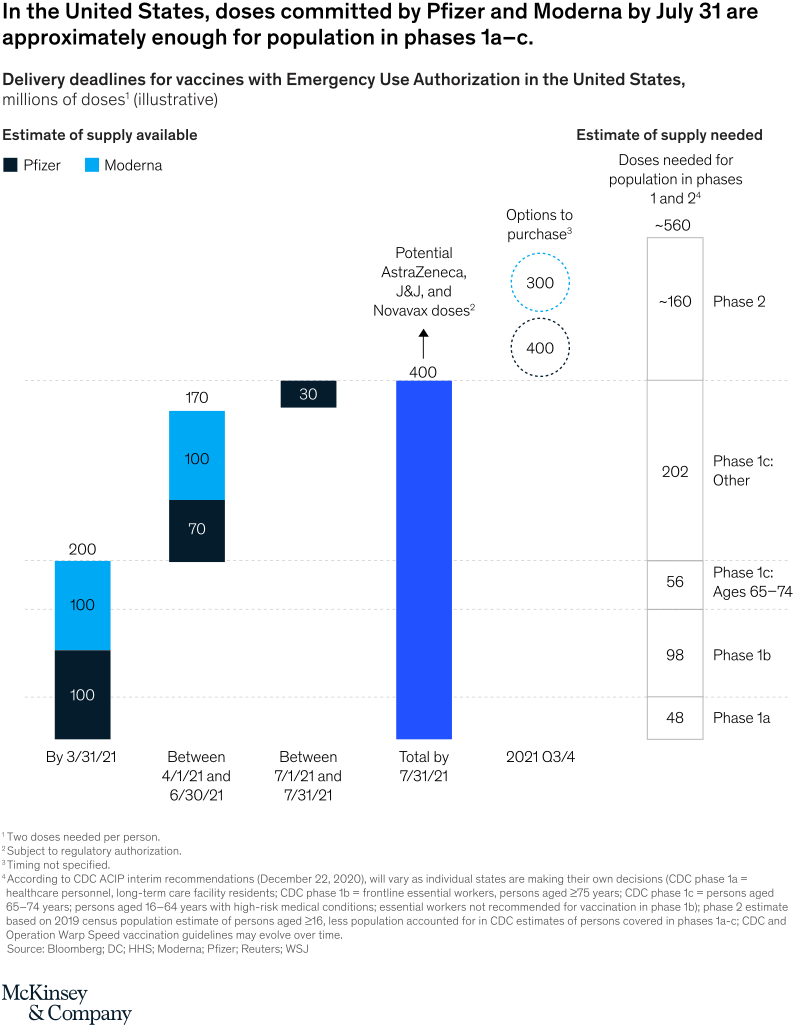
January 26, 2021 – Moderna and Pfizer–BioNTech are expected to deliver sufficient COVID-19-vaccine doses to inoculate all high-risk Americans, including healthcare personnel, frontline workers, and long-term-care-facility residents, in the first half of 2021. Additionally, other COVID-19 vaccines, including those approved in other markets (for example, the Oxford–AstraZeneca vaccine), are likely to become available.
To read the article, see “When will the COVID-19 pandemic end?,” January 20, 2021.
customizer here
Visual form
Supply-versus-need comparison chart with stacked columns.
Layout / body structure
The chart is split into a supply story on the left and a need story on the right. Read it from the time-window supply columns, to the total-by-July column and optional purchase bubbles in the middle, and then across to the stacked need block for phases 1 and 2.
What is being compared
The chart compares vaccine doses expected to be available in the United States from Pfizer and Moderna by different dates against the number of doses needed for the population in phases 1a to 1c and phase 2. It is a supply-timeline-versus-priority-population comparison.
Measurement system
The measurement is millions of doses. The left columns stack Pfizer in dark navy and Moderna in blue, the center total bar consolidates committed supply by July 31, and the right block stacks the phase populations with printed dose needs inside each segment.
Visible structure inside the graphic
On the left, the chart shows 200 doses by March 31, 170 more between April 1 and June 30, and 30 more between July 1 and July 31, producing a total of 400 by July 31. Two dotted circles beside the total show optional purchases of 300 and 400, while the right-side need block breaks out 48 for phase 1a, 98 for phase 1b, 56 for ages 65 to 74 in phase 1c, 202 for other phase 1c, and about 160 for phase 2, for a total near 560.
Main takeaway from the visual
Committed Pfizer and Moderna supply by July is shown as roughly enough to cover the population in phases 1a through 1c, but not enough to reach phase 2 without additional supply. The side-by-side structure makes the cutoff visually clear because the 400-dose total lines up below the full 560-dose need stack.
Key standout values or extremes
The committed supply totals 400 million doses by July 31 after building from 200, 170, and 30 across the three time windows. On the need side, the largest segment is Other in phase 1c at 202 million doses, phase 2 adds about 160 million more, and the full need stack reaches roughly 560 million doses.
Controls / sequence, when applicable
This is a static chart image with no in-chart controls to operate.
Companion media, when applicable
There is no separate companion audio or video; the chart image is the full visual on this page.