Source page: McKinsey & Company
Commentary
Hope on the horizon for people with serious, often rare, diseases
Healthcare
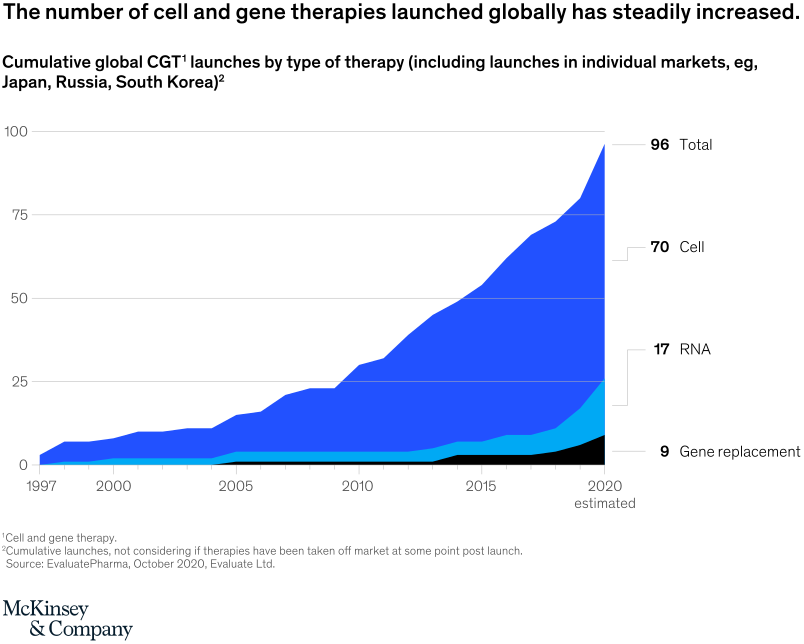
January 22, 2021 – Cell and gene therapies offer treatment, and sometimes cures, for patients with serious, often rare, and never-before-addressed diseases. And many more have become available in recent years—more than 75 launched worldwide in 2019, and 96 new ones were on track for the end of 2020.
To read the article, see “A call to action: Opportunities and challenges for CGTs in Europe,” January 19, 2021.
customizer here
Visual form
Stacked area chart.
Layout / body structure
The chart is a single cumulative time-series chart running from the late 1990s to the 2020 estimate, with the stacked therapy bands building upward over time. Read it from left to right to see the total launch count grow, then use the right-side labels to read the contribution of each therapy type.
What is being compared
The chart compares cumulative global launches of cell and gene therapies by therapy type. It separates the total into cell, RNA, and gene-replacement launches while also showing the all-in cumulative total.
Measurement system
The measurement is cumulative number of launches. The y-axis rises to 100, the total height of the stacked areas shows the running cumulative total, and the labels on the right give the estimated 2020 breakdown.
Visible structure inside the graphic
Three colored stacked bands fill the chart: a large royal-blue cell band, a thinner cyan RNA band, and a black gene-replacement band near the base. The top edge of the stack rises gradually at first and then more steeply after about 2010, and the right side annotates the final totals as 96 overall, 70 cell, 17 RNA, and 9 gene replacement.
Main takeaway from the visual
Global cell and gene therapy launches have accelerated over time, and the growth is dominated by cell therapies. The steepening upper boundary in the last decade and the much thicker cell layer make both the acceleration and the composition clear.
Key standout values or extremes
The cumulative total reaches 96 launches by the 2020 estimate. Of that total, cell therapies account for 70, RNA therapies account for 17, and gene-replacement therapies account for 9, making cell therapies by far the largest component.
Controls / sequence, when applicable
This is a static chart image with no in-chart controls to operate.
Companion media, when applicable
There is no separate companion audio or video; the chart image is the full visual on this page.