Source page: McKinsey & Company
Commentary
Here’s what’s in the digital-transformation tool kits of companies that manage risk best
Risk | Cybersecurity | Digital
January 20, 2021 – As companies go digital, they create new risks, such as loopholes that hackers can exploit. Companies that have already built sophisticated risk-management teams are applying their resources to find and mitigate them.
To read the article, see “Derisking digital and analytics transformations,” January 5, 2021.
customizer here
Visual form
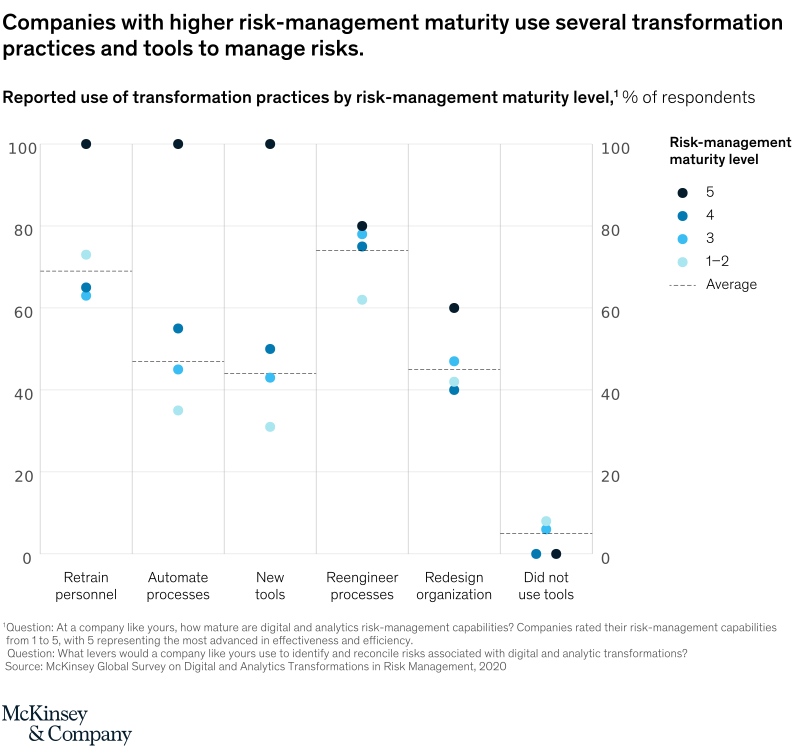
Multi-series dot plot.
Layout / body structure
The chart is a single panel with six practice categories across the horizontal axis and one vertical percentage scale shared by all of them. Read each category from top to bottom by maturity level, then compare across categories using the dashed average markers.
What is being compared
The chart compares reported use of transformation practices by risk-management maturity level. The practices include retraining personnel, automating processes, using new tools, reengineering processes, redesigning organization, and not using tools.
Measurement system
The measurement is percent of respondents. Each colored dot marks a maturity level from 1 to 2 through 5, and a short dashed horizontal segment shows the category average.
Visible structure inside the graphic
Each category forms a vertical stack of colored dots against a 0 to 100 scale, with darker dots representing more mature risk organizations. The left five categories place the dots progressively higher for stronger maturity levels, while the final category, did not use tools, flips low toward zero for the higher-maturity groups.
Main takeaway from the visual
Higher-maturity risk organizations use more transformation practices across nearly every category, while lower-maturity groups lag behind and are more likely to report not using tools. The most mature dark dots cluster at the top of the first five categories and near the bottom of the final one, which makes the maturity gradient easy to see.
Key standout values or extremes
Retrain personnel, automate processes, and new tools all reach roughly the 100-percent level for maturity level 5. Reengineer processes sits around the high 70s to low 80s for the upper maturity tiers, redesign organization tops out near the low 60s, and did not use tools falls to roughly 1 percent for the most mature groups while remaining higher for less mature ones.
Controls / sequence, when applicable
This is a static chart image with no in-chart controls to operate.
Companion media, when applicable
There is no separate companion audio or video; the chart image is the full visual on this page.