Source page: McKinsey & Company
Commentary
In a time of crisis, investors flocked to the familiar
Investing | North America
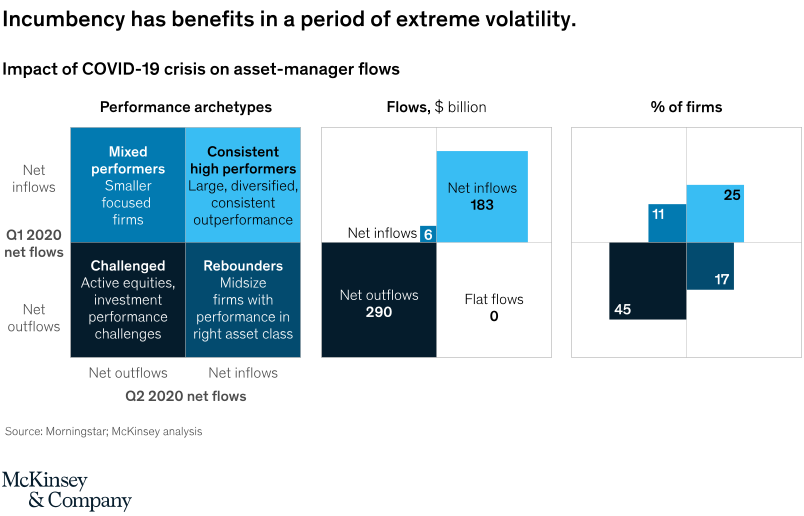
January 13, 2021 – During the first two quarters of 2020, investors placed their faith and their dollars with large, diversified, and well-established firms. Although these high performers comprised a seemingly representative sample of 25 percent of all firms in the industry, 80 percent of the flows to this group went to just ten asset managers, generating $183 billion in net inflows.
To read the report, see “North American asset management: A year of shocks but few surprises,” December 14, 2020.
customizer here
Visual form
Three-panel matrix and bar comparison chart.
Layout / body structure
The chart is laid out in three adjacent panels. Read the 2-by-2 performance-archetype matrix first, then the flows panel in the middle, and finally the percent-of-firms panel on the right.
What is being compared
The chart compares four asset-manager performance archetypes by their Q1 and Q2 2020 net-flow direction, their total dollar flows, and their share of firms. It contrasts mixed performers, consistent high performers, challenged firms, and rebounders during the COVID-19 crisis.
Measurement system
The center panel uses billions of dollars of flows, and the right panel uses percent of firms. The left panel is categorical, placing each archetype in a quadrant defined by Q1 and Q2 net inflows or outflows.
Visible structure inside the graphic
The left panel is a square 2-by-2 grid with one archetype in each quadrant. The middle panel turns those archetypes into flow blocks labeled net inflows 183, net inflows 6, net outflows 290, and flat flows 0, while the right panel shows firm-share bars labeled 25, 11, 17, and 45.
Main takeaway from the visual
Incumbent or consistently strong firms captured the upside in flows during volatility, while challenged firms absorbed the deepest outflows. The combination of the quadrant framing and the much larger inflow and outflow blocks in the middle panel makes the familiar-winners-versus-strugglers split easy to see.
Key standout values or extremes
Consistent high performers show the largest net inflows at 183 billion dollars and account for 25 percent of firms. Challenged firms show the largest net outflows at 290 billion dollars and represent 45 percent of firms, while rebounders are smaller at 17 percent of firms and mixed performers sit at 11 percent with modest inflows of 6 billion.
Controls / sequence, when applicable
This is a static chart image with no in-chart controls to operate.
Companion media, when applicable
There is no separate companion audio or video; the chart image is the full visual on this page.