Source page: McKinsey & Company
Commentary
How will you be getting around in 2030? It depends on where you live.
Mobility
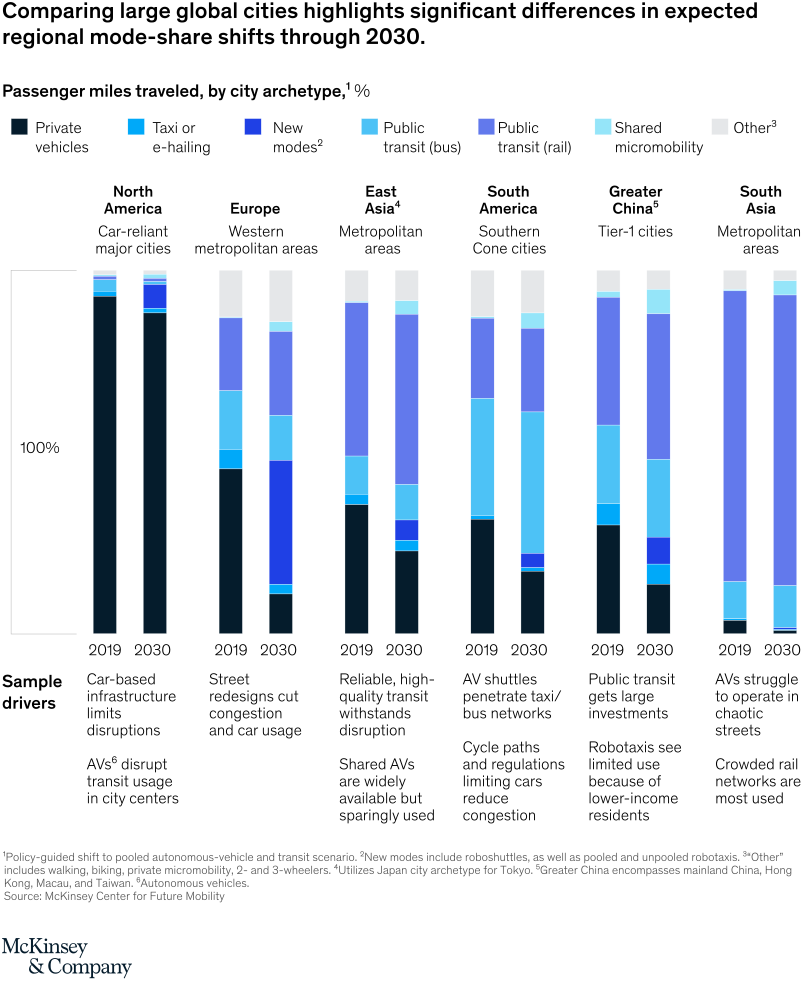
January 12, 2021 – There won’t be much of a shift away from private vehicles in North America over the coming decade—largely because there aren’t many incentives for drivers to change their behavior. But Europeans may ditch private vehicles for robo-shuttles and robo-taxis, and in Greater China, people may increasingly change to bus and rail.
To read the article, see “From no mobility to future mobility: Where COVID-19 has accelerated change,” December 15, 2020.
customizer here
Visual form
Grouped stacked bar chart.
Layout / body structure
The chart is a single page of paired stacked columns grouped by six city archetypes. Read each regional pair from 2019 to 2030, then move left to right across North America, Europe, East Asia, South America, Greater China, and South Asia, using the sample-driver notes beneath each pair as interpretation aids.
What is being compared
The chart compares passenger miles traveled by transport mode in 2019 versus 2030 for different urban archetypes. Within each pair it compares private vehicles, taxi or e-hailing, new modes, public transit by bus and rail, shared micromobility, and other travel modes.
Measurement system
The measurement is mode-share percentage. Each vertical column totals 100 percent, and the colored stacked segments show how the share of each mode changes between the two years.
Visible structure inside the graphic
Each region gets two tall stacked bars labeled 2019 and 2030, with a legend across the top mapping dark navy, blues, and gray to the transport modes. The sample-driver text below each pair explains the structural reasons behind the shifts, such as street redesigns, AV shuttle penetration, public-transit investment, robotaxi limits, and crowded rail networks.
Main takeaway from the visual
Mode-share shifts are not uniform across cities, and the regional archetype matters as much as the year. North America remains overwhelmingly private-car heavy, while South Asia and parts of East and Greater China are far more transit-centered by 2030, making the cross-region contrast the dominant message.
Key standout values or extremes
North America stays dominated by private vehicles in both years with only small visible changes in the upper transit and shared-mode slices. South Asia shows the strongest visual dominance of public transit rail by 2019 and 2030, and Europe shows one of the clearest declines in private-vehicle share as bus, rail, and new modes expand.
Controls / sequence, when applicable
This is a static chart image with no in-chart controls to operate.
Companion media, when applicable
There is no separate companion audio or video; the chart image is the full visual on this page.