Source page: McKinsey & Company
Commentary
From start-up to world-beater: HDFC Bank's steady rise
Banking | Leadership | India
January 11, 2021 – Twenty-six years ago, Aditya Puri took charge of a new bank in Mumbai. Under his leadership, HDFC Bank became the highest-valued financial institution in India and the tenth-most-valuable bank in the world, with a record of market-beating performance.
To read the interview, see “‘Keep it simple’: Aditya Puri on HDFC Bank’s path to market leadership,” December 14, 2020.
customizer here
Visual form
Multi-series line chart.
Layout / body structure
The chart is a single time-series panel covering January 2010 through late 2020, with a summary panel on the right and market-capitalization figures along the bottom. Read the three lines left to right, then use the CAGR comparison and market-cap milestones as supporting context.
What is being compared
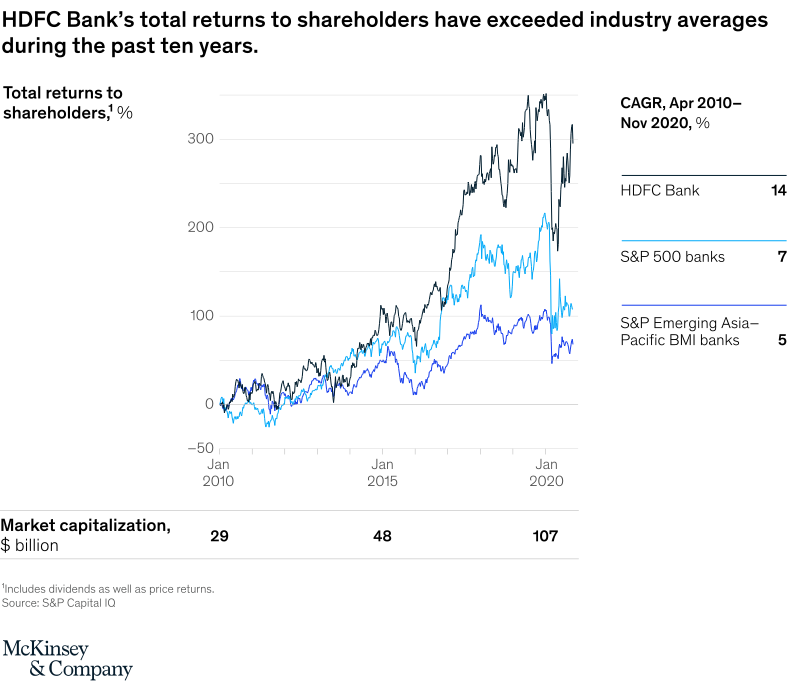
The chart compares total returns to shareholders for HDFC Bank, the S&P 500 banks, and the S&P Emerging Asia-Pacific BMI banks. It is a performance-versus-benchmark comparison across roughly a decade.
Measurement system
The measurement is total return to shareholders in percentage terms. The line positions show relative return performance over time, while the right-hand summary lists CAGR from April 2010 to November 2020 and the bottom row lists market-capitalization snapshots in billions of dollars.
Visible structure inside the graphic
Three lines share the same grid: a dark HDFC Bank line, a light blue S&P 500 banks line, and a darker blue Asia-Pacific bank benchmark line. The HDFC line rises much higher than the two benchmark lines, and the right-hand legend-style panel prints CAGRs of 14, 7, and 5 beside the series names.
Main takeaway from the visual
HDFC Bank materially outperformed both benchmark groups over the past decade. The gap widens especially after the mid-2010s, and the dark line remains well above the others even through the late-period volatility.
Key standout values or extremes
The CAGR panel shows 14 percent for HDFC Bank versus 7 percent for S&P 500 banks and 5 percent for S&P Emerging Asia-Pacific BMI banks. The bottom market-cap figures rise from 29 to 48 to 107 billion dollars across the marked milestones, reinforcing the scale of HDFC’s growth.
Controls / sequence, when applicable
This is a static chart image with no in-chart controls to operate.
Companion media, when applicable
There is no separate companion audio or video; the chart image is the full visual on this page.