Source page: McKinsey & Company
Commentary
Low stakes: $12 billion to reduce Americans’ vaccine skepticism could add $1 trillion to economy
COVID-19 | Public Health | North America
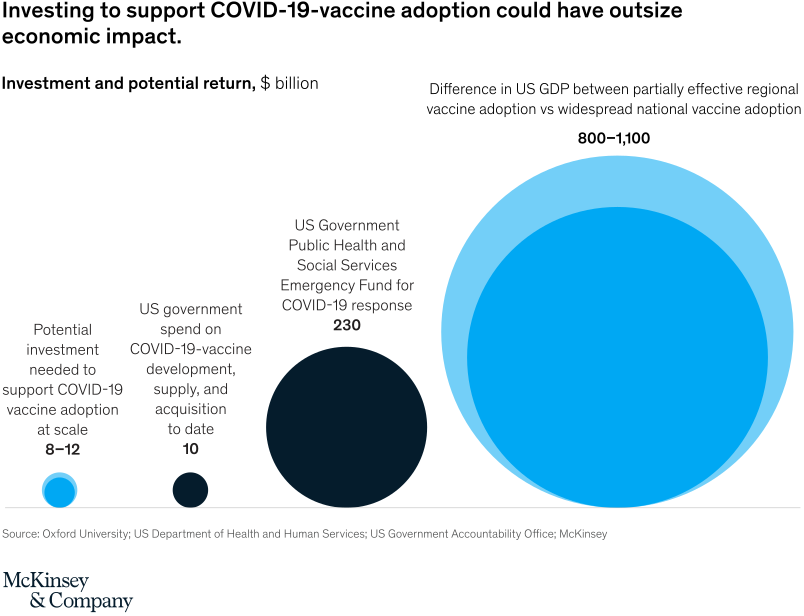
January 8, 2021 – The US government has already spent considerable sums to fight the COVID-19 pandemic. Now, a modest new investment of around $12 billion to educate and encourage vaccine skeptics could hasten the pandemic’s end and add around $1 trillion to US GDP.
To read the article, see “COVID-19 vaccines meet 100 million uncertain Americans,” December 18, 2020.
customizer here
Visual form
Bubble comparison chart.
Layout / body structure
The chart is a single horizontal comparison of four circles sized by amount, with explanatory labels placed beside each bubble. Read the small investment bubbles at the left first, then the larger current public-spending bubble, and finally the largest GDP-difference bubble on the right.
What is being compared
The chart compares the potential investment needed to support COVID-19 vaccine adoption, total US government vaccine-related spending to date, the Emergency Fund for COVID-19 response, and the GDP difference between partial regional adoption and widespread national adoption. It is an investment-versus-potential-return scale comparison.
Measurement system
The measurement is billions of dollars. Bubble area is the main encoding, and the printed numeric labels anchor the approximate values for each circle.
Visible structure inside the graphic
Four bubbles sit on a common baseline: a light-blue bubble labeled 8 to 12, a dark small bubble labeled 10, a larger dark bubble labeled 230, and a much larger blue bubble labeled 800 to 1,100. The labels beside each bubble explain what each amount represents, turning the page into a clean left-to-right size comparison.
Main takeaway from the visual
A relatively small investment in vaccine adoption is shown as tiny compared with the economic value associated with broad adoption. The visual argument comes from the dramatic size jump from the leftmost small circles to the giant GDP-difference circle on the right.
Key standout values or extremes
The potential investment needed to support vaccine adoption at scale is shown as 8 to 12 billion dollars, while current US government vaccine development, supply, and acquisition spending is 10 billion in the chart’s framing. The Emergency Fund is 230 billion, and the largest bubble shows an estimated 800 to 1,100 billion dollar GDP difference under broader national adoption.
Controls / sequence, when applicable
This is a static chart image with no in-chart controls to operate.
Companion media, when applicable
There is no separate companion audio or video; the chart image is the full visual on this page.