Source page: McKinsey & Company
Commentary
The cost of basic necessities rose much faster than inflation this century
COVID-19 | Economy
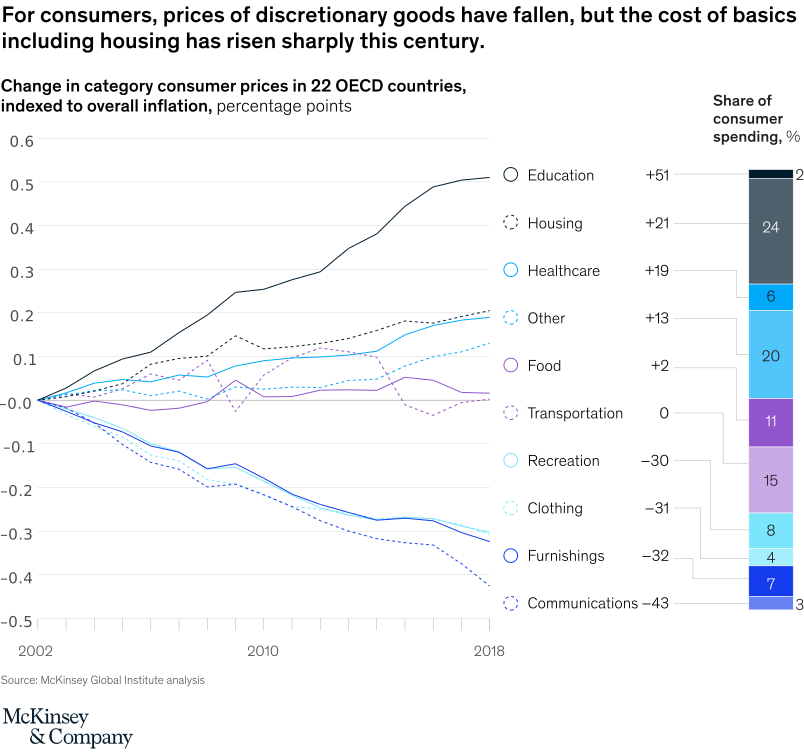
January 7, 2021 – Housing, healthcare, and education costs have risen sharply, while discretionary costs such as communications, clothing, and furnishings have fallen.
To read the article, see “COVID-19 has revived the social contract in advanced economies—for now. What will stick once the crisis abates?,” December 10, 2020.
customizer here
Visual form
Multi-series line chart with companion stacked spending bar.
Layout / body structure
The chart has a large line chart on the left and a stacked consumer-spending share bar on the right. Read the category lines from 2002 to 2018 first, then use the right-side bar and labels to see how much of consumer spending sits in each category.
What is being compared
The chart compares consumer price changes by category in 22 OECD countries, indexed to overall inflation, across the years 2002 to 2018. It also compares those categories by their share of consumer spending.
Measurement system
The left panel measures percentage-point change relative to overall inflation, while the right panel measures percent share of consumer spending. The lines show cumulative divergence above or below inflation, and the stacked bar breaks down spending weights by category.
Visible structure inside the graphic
Multiple colored lines fan out from zero in 2002 and diverge over time, with education rising highest, housing and healthcare staying above zero, and communications, furnishings, clothing, and recreation trending downward. On the right, a vertical stacked bar is labeled with spending shares such as 24 for housing, 20 for healthcare, 15 for food, 11 for transportation, and smaller slices for other categories.
Main takeaway from the visual
Basic necessities, especially housing and healthcare, rose faster than overall inflation, while many discretionary goods became relatively cheaper. The split between the upward-sloping essentials lines and the downward-sloping discretionary lines makes that long-run divergence visually unmistakable.
Key standout values or extremes
Education is the highest line at about plus 51 percentage points versus inflation, followed by housing at plus 21 and healthcare at plus 19. Communications is the lowest at about minus 43, with furnishings at minus 32, clothing at minus 31, and recreation at minus 30, while housing also carries the largest spending share at 24 percent.
Controls / sequence, when applicable
This is a static chart image with no in-chart controls to operate.
Companion media, when applicable
There is no separate companion audio or video; the chart image is the full visual on this page.