Source page: McKinsey & Company
Commentary
Large consumer-goods brands need a 2021 playbook
Retail | Consumer
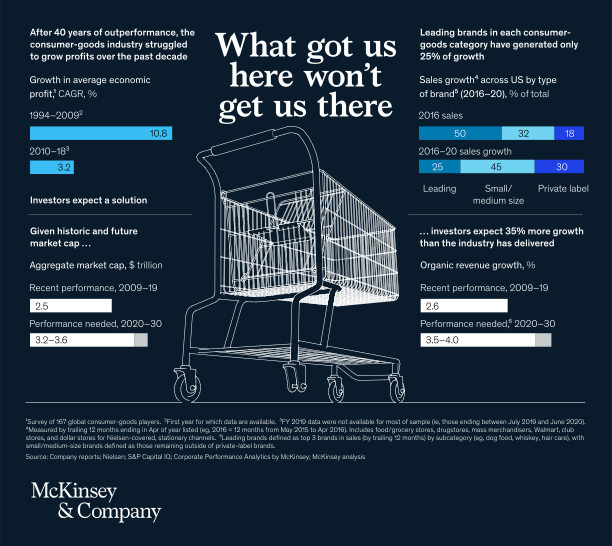
January 4, 2021 – The consumer-goods industry as a whole has struggled to grow profits over the last decade, and large brands are generating less sales growth than small, medium, and private-label brands. Compounding the challenges, the industry has to deliver 35 percent more growth to meet investors’ expectations through 2030.
To read the article, see “A new model for the consumer-goods industry,” December 15, 2020.
customizer here
Visual form
Infographic with embedded bar comparisons.
Layout / body structure
The chart is a full-page infographic centered on a wireframe shopping cart, with metric blocks arranged to the left and right of the central illustration. Read the left-side growth and market-cap figures first, then the right-side sales-growth comparison and the expected-versus-delivered growth block.
What is being compared
The chart compares long-run profit growth for large consumer-goods brands across two decades, compares sales growth by brand size in leading categories, and compares recent organic revenue growth with the higher growth needed to satisfy investors. It is a growth-performance-versus-expectation comparison built from several supporting metrics.
Measurement system
The measurements are CAGR percentages, sales-growth shares, and trillions of dollars of market capitalization. Short horizontal bars, labeled values, and side-by-side numeric blocks carry the main comparisons rather than one single axis-based chart.
Visible structure inside the graphic
On the left, the infographic shows average economic-profit CAGR dropping from 10.8 in 1994 to 2009 to 3.2 in 2010 to 2018, alongside aggregate market-cap figures of 2.5 and 3.2 to 3.6 trillion dollars. On the right, it shows 2016 sales shares of 50, 32, and 18 for leading, small or medium, and private-label brands, then 25, 45, and 30 for 2016 to 2020 sales growth, plus a final comparison between recent organic revenue growth of 2.6 and performance needed of 3.5 to 4.0.
Main takeaway from the visual
The central message is that the historical playbook no longer produces enough growth, and large consumer-goods brands need a different model to meet future expectations. The contrast between past outperformance and the lower more recent growth figures is reinforced visually on both sides of the cart illustration.
Key standout values or extremes
Average economic-profit CAGR falls from 10.8 percent in 1994 to 2009 to 3.2 percent in 2010 to 2018. Recent organic revenue growth is 2.6 percent, while the performance needed for 2020 to 2030 is 3.5 to 4.0 percent, and the sales-growth comparison shows smaller and private-label brands gaining more than leading brands over 2016 to 2020.
Controls / sequence, when applicable
This is a static chart image with no in-chart controls to operate.
Companion media, when applicable
There is no separate companion audio or video; the chart image is the full visual on this page.