Source page: McKinsey & Company
Commentary
Global banks steel themselves against larger potential loan losses than seen in the Great Recession
COVID-19 | Banking | Financial services
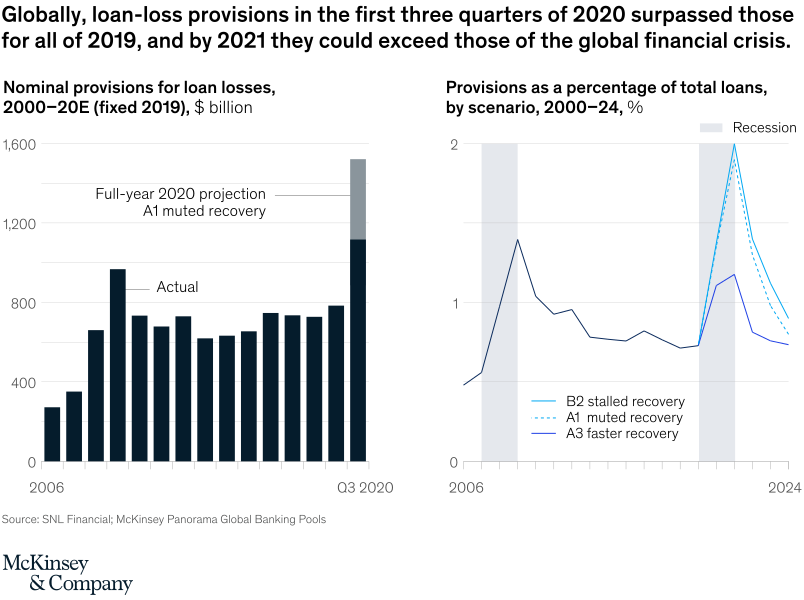
December 17, 2020 – In anticipation of a sharp increase in personal and corporate defaults due to the COVID-19 crisis, global banks have provisioned $1.15 trillion for loan losses through the third quarter of 2020—more than they did in all of 2019. We project that loan-loss provisions in the coming years will exceed those of the global financial crisis.
To read the report, see “McKinsey’s Global Banking Annual Review,” December 9, 2020.
customizer here
Visual form
Two-panel bar-and-line comparison chart.
Layout / body structure
The chart is split into a left bar chart and a right line chart. Read the bar chart first to see how nominal loan-loss provisions changed over time and where the 2020 projection sits, then move to the right panel to compare scenario paths for provisions as a percentage of total loans.
What is being compared
The chart compares historical and projected global loan-loss provisions in dollar terms and then compares three recovery scenarios for provisions as a share of total loans. It is a time-series comparison across both absolute and relative measures.
Measurement system
The left panel uses billions of dollars, while the right panel uses percent of total loans. The left side encodes scale with bar height, and the right side uses line trajectories to distinguish the B2 stalled recovery, A1 muted recovery, and A3 faster recovery scenarios.
Visible structure inside the graphic
On the left, a series of dark bars runs from 2006 through Q3 2020, with a labeled extension showing the full-year 2020 projection near the 1,500 mark. On the right, three colored lines rise and fall across the same long time span, with recession windows shaded in gray and a sharp spike around 2021 before each line trends down toward 2024.
Main takeaway from the visual
Loan-loss provisions in 2020 already outstripped the prior year, and under the weaker scenarios they are shown rising to levels above the global financial crisis. The left projection bar and the right-side scenario spike together make the scale of the potential banking hit hard to miss.
Key standout values or extremes
The full-year 2020 projection reaches about 1,500 billion dollars, far above the recent precrisis bars clustered around the 700 to 800 range. In the right panel, the A1 muted recovery line peaks near 2 percent of total loans around 2021, while the other scenarios peak lower and then decline.
Controls / sequence, when applicable
This is a static chart image with no in-chart controls to operate.
Companion media, when applicable
There is no separate companion audio or video; the chart image is the full visual on this page.