Source page: McKinsey & Company
Commentary
Here's why the poorest countries in Asia are most at risk from climate change
Climate change | Asia-Pacific
December 3, 2020 – Climate change will affect all countries in Asia, but those with lower levels of per capita GDP will suffer most because their economies rely more on outdoor work and natural capital. And as it gets hotter, people won’t be able to work outdoors as much.
To read the report, see “Climate risk and response in Asia,” November 24, 2020.
customizer here
Visual form
Matrix-style risk table.
Layout / body structure
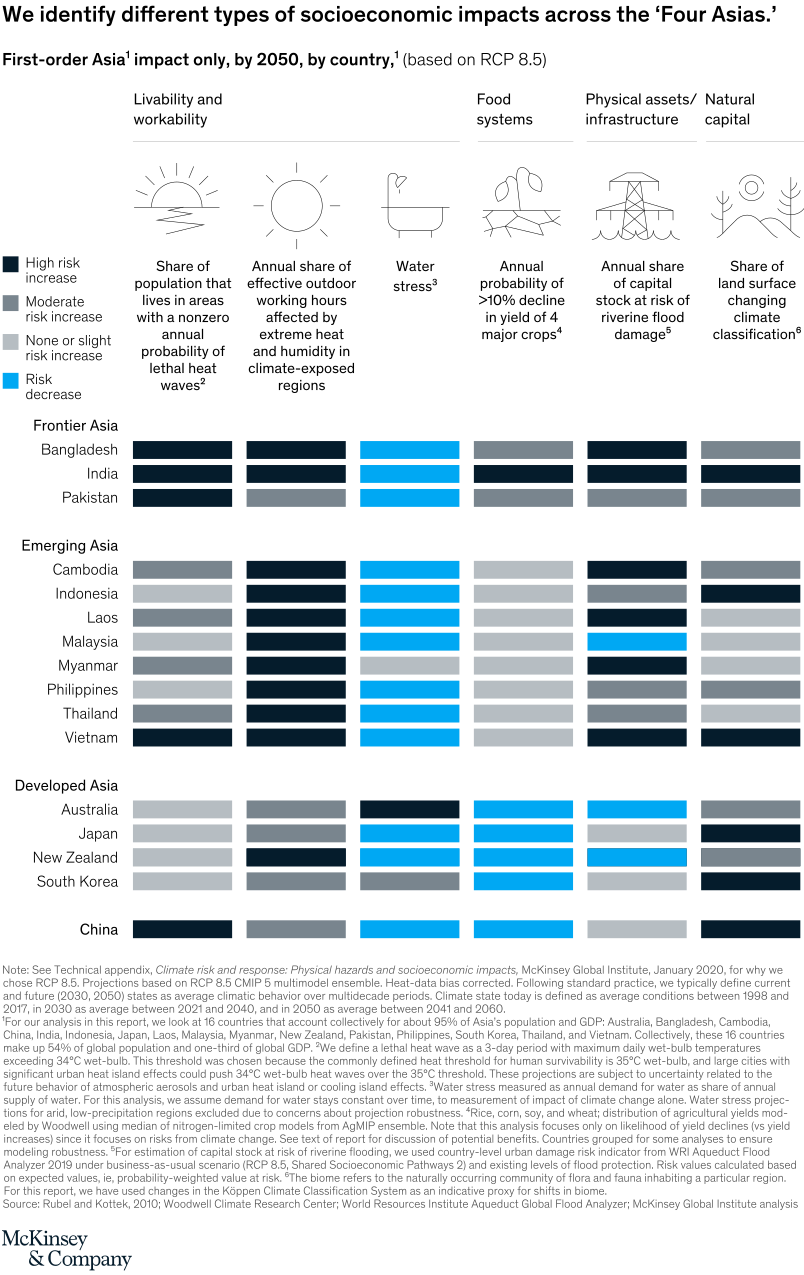
The chart is a large grid with countries arranged in grouped rows and climate-impact dimensions arranged in columns. Read top to bottom within each country group and left to right across the six impact columns, using the group labels to move from Frontier Asia to Emerging Asia, Developed Asia, and China.
What is being compared
It compares how different types of socioeconomic climate impacts are expected to change by 2050 across 16 Asian countries grouped into the Four Asias. The columns cover livability and workability, food systems, physical assets and infrastructure, and natural capital measures.
Measurement system
The graphic uses categorical risk labels rather than a numeric axis, with entries such as high risk increase, moderate risk increase, none or slight risk increase, and risk decrease. Each cell tells the reader how severe the projected change is for one country on one impact dimension.
Visible structure inside the graphic
Country rows are grouped under Frontier Asia, Emerging Asia, Developed Asia, and China, while the columns split into six specific impact measures: lethal heat-wave exposure, outdoor working hours affected, water stress, crop-yield decline risk, riverine-flood capital-stock risk, and land-surface climate change. The body of the chart is the grid of text-filled cells, where repeated high-risk labels make the most exposed countries stand out immediately.
Main takeaway from the visual
The poorest parts of Asia carry the broadest concentration of high-risk cells across the table. Frontier Asia in particular shows repeated high-risk increases in heat, workability, flooding, and natural-capital measures, which is why the chart makes lower-income countries look structurally more exposed than richer ones.
Key standout values or extremes
Bangladesh and India each show multiple high-risk increases across the row, while Pakistan also stacks several elevated-risk cells. By contrast, many Developed Asia rows contain more risk decreases or none-or-slight increases, even though specific pressures such as water stress in Australia or climate-classification change in Japan and South Korea still stand out.
Controls / sequence, when applicable
This is a static chart image with no in-chart controls to operate.
Companion media, when applicable
There is no separate companion audio or video; the chart image is the full visual on this page.