Source page: McKinsey & Company
Commentary
Digital fast-forward: Homebound consumers forced companies to jump years ahead
COVID-19 | Digital | Surveys
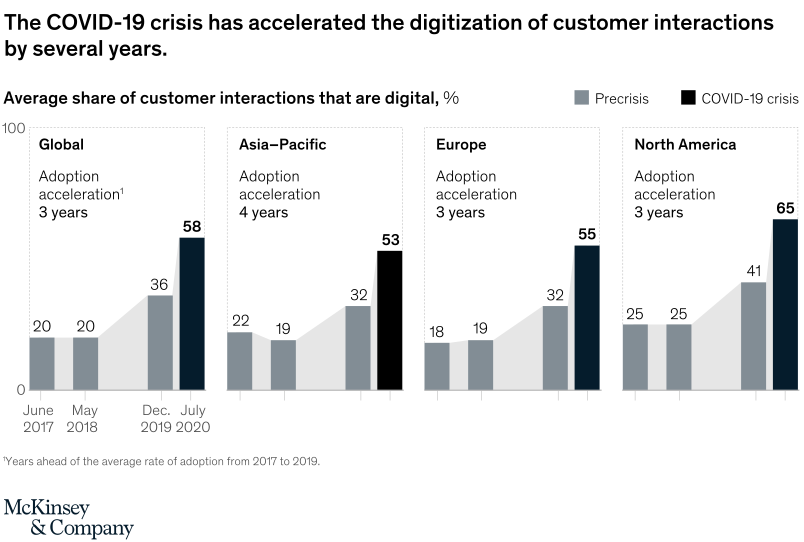
November 20, 2020 – In response to the crisis, companies have accelerated the digitization of their customer interactions, accomplishing three or four years of progress in seven months.
To read the survey, see “How COVID-19 has pushed companies over the technology tipping point—and transformed business forever,” October 5, 2020.
customizer here
Visual form
Multi-line time-series chart with acceleration callouts.
Layout / body structure
The chart is a single time-series comparison with regional lines tracked from precrisis dates into July 2020, paired with short callouts summarizing the years of acceleration. Read the lines left to right across time first, then use the acceleration labels to compare regions.
What is being compared
It compares the average share of customer interactions that are digital across the global average, Asia-Pacific, Europe, and North America. The visual is contrasting precrisis digital adoption with adoption during the COVID-19 crisis.
Measurement system
The measure is percentage share of customer interactions that are digital. The time points are June 2017, May 2018, December 2019, and July 2020, and the callouts translate the slope change into years of adoption acceleration.
Visible structure inside the graphic
Multiple regional lines run across the same timeline, starting in the low twenties in the precrisis period and then rising sharply by July 2020. Beside those lines, short summary callouts state the number of years of digital acceleration for each geography, linking the visual jump to a simple regional takeaway.
Main takeaway from the visual
Digital customer interaction adoption did not just rise during the crisis; it jumped forward by several years in a matter of months. The steep late-period climb across every line makes the pandemic look like an acceleration event rather than a continuation of the old trend.
Key standout values or extremes
Globally, the digital share rises from 36 percent in December 2019 to 58 percent in July 2020. North America reaches the highest July 2020 level at 65 percent, while Asia-Pacific records the largest acceleration callout at four years ahead; the other regions are marked at three years ahead.
Controls / sequence, when applicable
This is a static chart image with no in-chart controls to operate.
Companion media, when applicable
There is no separate companion audio or video; the chart image is the full visual on this page.