Source page: McKinsey & Company
Commentary
Management matters for industrial companies that buck industry trends
Industrial machinery | Industrials & Electronics
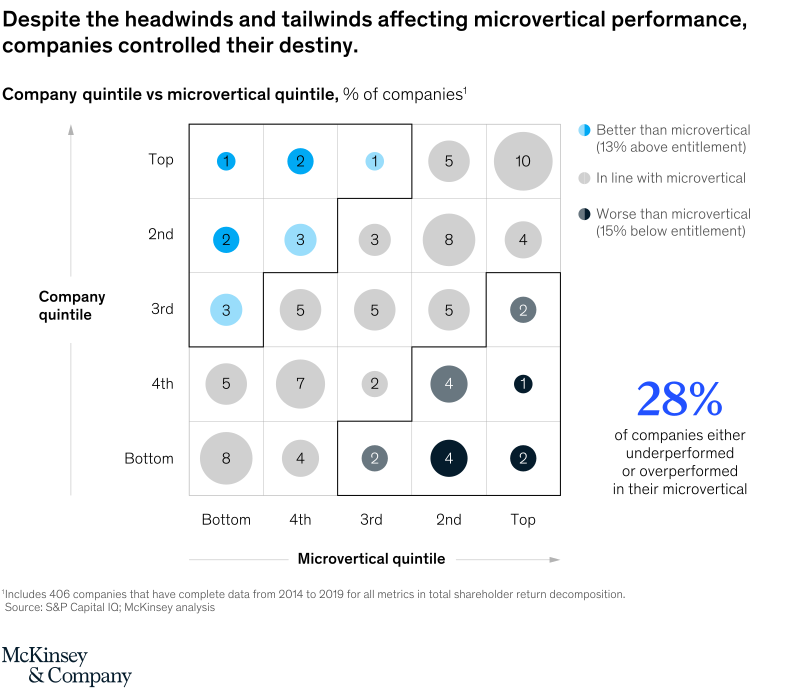
November 18, 2020 – The industrials sector is comprised of “microverticals”—ranging from makers of giant industrial machinery to manufacturers of tiny electronic components. All faced either headwinds or tailwinds in the period from 2014–19, but almost 30 percent of companies outperformed their microvertical peers.
To read the report, see “Value creation in industrials,” November 10, 2020.
customizer here
Visual form
Performance matrix chart.
Layout / body structure
The chart is a single matrix that compares company performance against the performance of each company’s microvertical. Read the grid by locating where company performance sits relative to microvertical conditions, then use the diagonal and off-diagonal cells to see who followed or broke from the broader industry trend.
What is being compared
It compares individual industrial companies’ performance quintiles with the quintile performance of their microverticals from 2014 to 2019. The chart is showing whether companies moved with the headwinds or tailwinds of their niche or outperformed those conditions.
Measurement system
The framework uses quintiles based on total shareholder return CAGR rather than a continuous numeric axis. One dimension represents the company’s own TSR performance, while the other represents the TSR performance of the microvertical the company belongs to.
Visible structure inside the graphic
The matrix is organized as a grid of cells where the diagonal shows companies performing roughly in line with their microverticals and the off-diagonal areas show companies that beat or lagged what their microvertical conditions would predict. The visual therefore separates structural industry effects from company-specific execution.
Main takeaway from the visual
The chart shows that microvertical conditions matter, but they do not fully determine outcomes. A meaningful share of companies sit away from the expected diagonal, which makes the case that management choices can overcome headwinds or squander tailwinds.
Key standout values or extremes
The key anchor is that about 30 percent of companies either outperformed or underperformed what their microvertical classification would have predicted. The surrounding context from the source report also shows a 2,600-basis-point TSR gap between top- and bottom-quintile microverticals, which explains why escaping the neighborhood trend is such a visible result.
Controls / sequence, when applicable
This is a static chart image with no in-chart controls to operate.
Companion media, when applicable
There is no separate companion audio or video; the chart image is the full visual on this page.