Source page: McKinsey & Company
Commentary
With proper reforms, India’s manufacturers could add $320 billion to GDP over just seven years
India | Manufacturing
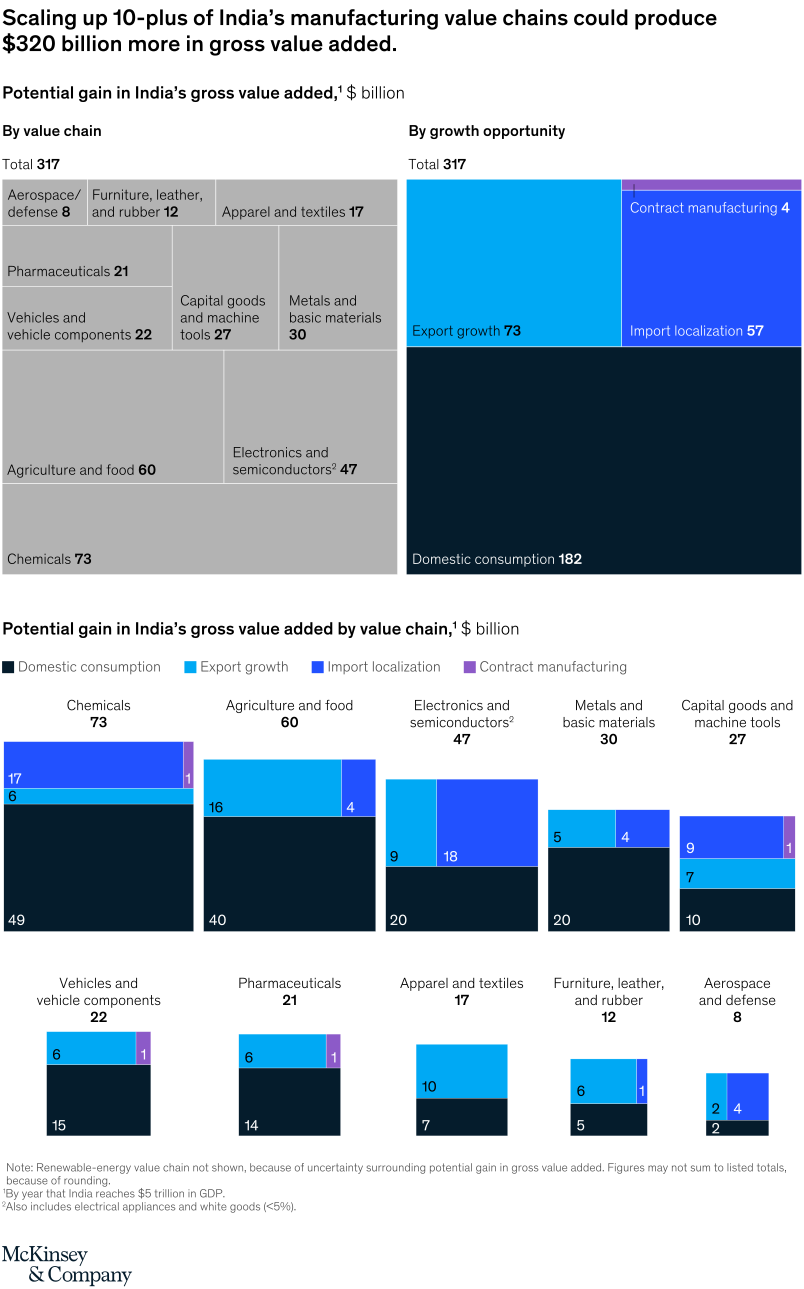
November 12, 2020 – With the proper reforms, the ten industries shown below—plus renewable energy—could compete well in international markets, spur domestic consumption, and provide long-term employment for millions. As a result, they’d add $320 billion more in gross value than they do now, helping India realize its manufacturing promise.
To read the article, see “A new growth formula for manufacturing in India,” October 30, 2020.
customizer here
Visual form
Value-chain contribution chart.
Layout / body structure
The chart is a single comparison view that lines up India’s high-potential manufacturing value chains and shows how much additional GDP each could contribute. Read across the value-chain list to compare the size of each contribution, then step back to see how much of the total is concentrated in the largest few chains.
What is being compared
It compares the additional GDP or gross value added that different Indian manufacturing value chains could generate if they scale successfully. The chart is contrasting sectors such as chemicals and petrochemicals, agriculture and food processing, electronics and semiconductors, capital goods and machine tools, iron and steel, automotive, and the rest of the 10-plus manufacturing chains plus renewable energy.
Measurement system
The measurement is dollars in billions of additional GDP or GVA, with the full chart anchored by the 320 billion total. Each value chain sits on the same monetary scale so the reader can compare which sectors contribute most to that aggregate upside.
Visible structure inside the graphic
The visual is organized as a ranked or side-by-side sector breakdown, with the largest value chains occupying the most visual weight and the smaller ones grouped around them. The design is meant to show both the spread across many chains and the concentration of most of the upside in a smaller set of heavy contributors.
Main takeaway from the visual
India’s manufacturing upside is large, but it is not evenly distributed across sectors. The chart makes clear that a handful of value chains drive most of the 320 billion opportunity, so manufacturing reform would need to prioritize those sectors instead of treating the entire landscape as equally important.
Key standout values or extremes
The main numeric anchor is the 320 billion dollars of additional GDP potential over seven years. The source analysis also states that about 80 percent of that potential sits in six value chains, which is the clearest sign of how concentrated the upside is.
Controls / sequence, when applicable
This is a static chart image with no in-chart controls to operate.
Companion media, when applicable
There is no separate companion audio or video; the chart image is the full visual on this page.