Source page: McKinsey & Company
Commentary
A positive pivot? Global executives seem the most bullish about their businesses since the early pandemic days of March
COVID-19 | Surveys
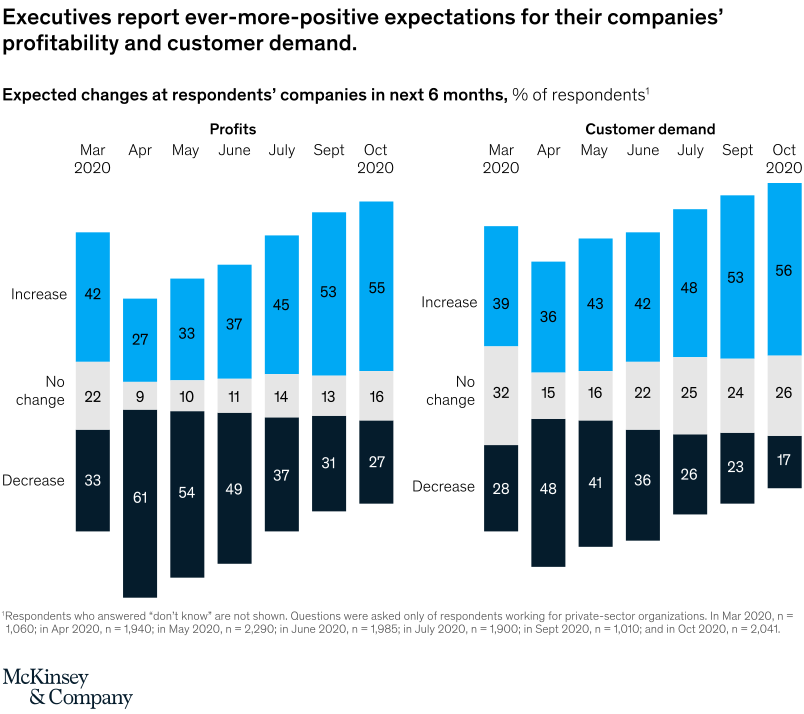
November 5, 2020 – As of mid-October, the share of executives who expected their companies’ profits to increase was double what it was six months before, according to surveys we’ve conducted monthly since March. A similar share predicts that customer demand too will increase.
To read the survey, see “The coronavirus effect on global economic sentiment,” October 29, 2020.
customizer here
Visual form
Two-panel stacked time-series bar chart.
Layout / body structure
The chart is split into two stacked panels, one for profits and one for customer demand, with the same monthly timeline running from March to October 2020 in each. Read the profits panel left to right first, then move to the customer-demand panel and compare how the balance of increase, no change, and decrease expectations shifts month by month in the same sequence.
What is being compared
It compares executives’ expectations for changes in profits and customer demand over the next six months. Within each panel, the chart compares monthly survey responses from March, April, May, June, July, September, and October 2020.
Measurement system
The measure is percent of respondents, divided into increase, no change, and decrease categories for each month. Each monthly bar uses the same response split, allowing direct comparison of sentiment changes over time in both profits and demand.
Visible structure inside the graphic
Each panel is a run of monthly stacked bars, with the increase share growing larger as the decrease share shrinks from spring into October. Because profits and customer demand use the same layout, the reader can compare the two series as parallel recovery sentiment tracks.
Main takeaway from the visual
Executives became steadily more optimistic as 2020 progressed, with October marking the strongest positive sentiment since the early pandemic shock. The visual shows the pessimistic spring pattern giving way to bars dominated by expected increases, especially in the later months.
Key standout values or extremes
In profits, the increase share rises from 27 percent in April to 55 percent in October while the decrease share falls from 61 percent to 27 percent. In customer demand, the increase share reaches 56 percent in October versus 36 percent in April, while the decrease share drops from 48 percent to 17 percent over the same span.
Controls / sequence, when applicable
This is a static chart image with no in-chart controls to operate.
Companion media, when applicable
There is no separate companion audio or video; the chart image is the full visual on this page.