Source page: McKinsey & Company
Commentary
A pandemic digital silver lining: Companies digitized many activities 20 to 25 times faster during COVID-19
COVID-19 | Digital
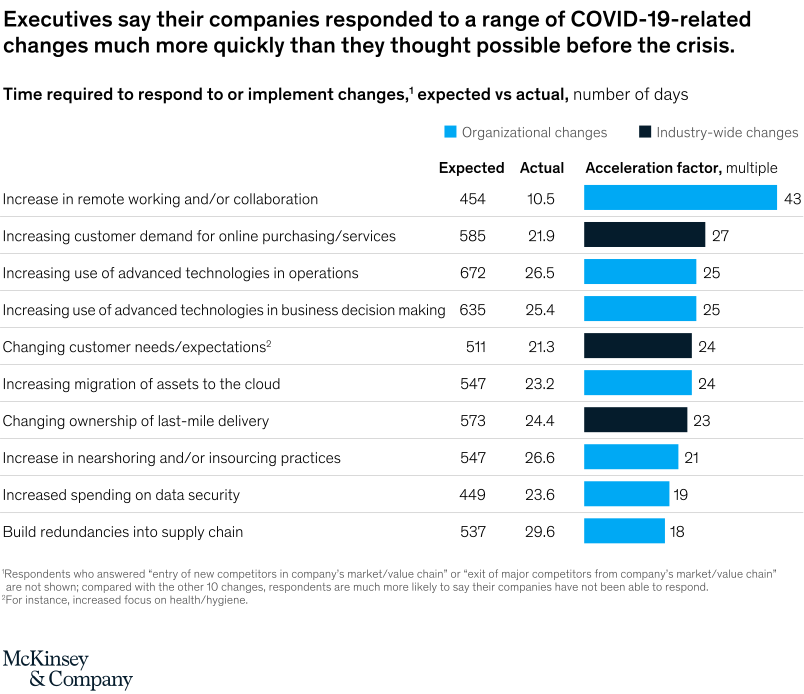
October 28, 2020 – We asked executives how long they expected it would have taken their companies prepandemic to digitize 12 different activities and how long it actually took them once the coronavirus hit. When it came to remote working, companies moved 43 times more quickly than executives thought possible.
To read the article, see “How COVID-19 has pushed companies over the technology tipping point—and transformed business forever,” October 5, 2020.
customizer here
Visual form
Table (with Visual Encoding): multi-row expected-versus-actual digitization-speed comparison.
Layout / body structure
Each row names one business change, then aligns expected implementation time, actual implementation time, acceleration multiple, and change type. The reader scans down the rows to compare speed compression across activities.
What is being compared
It compares pre-COVID expectations for how long digital and operating changes would take with the actual time companies took after the pandemic began.
Measurement system
The main units are days and acceleration multiples. A final label classifies each change as organizational or industry-wide.
Visible structure inside the graphic
The repeated row structure makes the compression visible: expected timelines are long, actual timelines are short, and the multiple column shows how sharply implementation sped up.
Main takeaway from the visual
The chart shows that COVID-19 compressed digital change across many activities, not just remote work. Companies executed changes far faster than executives had thought possible.
Key standout values or extremes
Remote working and collaboration falls from an expected 454 days to 10.5 days, a 43-times acceleration. Online purchasing or services falls from 585 to 21.9 days, and advanced technologies in operations falls from 672 to 26.5 days, both around 25 times faster.
Controls / sequence, when applicable
This is a static visually encoded comparison table; there are no in-chart controls to operate.
Companion media, when applicable
There is no separate companion audio or video; the digitization-speed comparison table is the full visual on this page.