Source page: McKinsey & Company
Commentary
Asian companies underrepresented among top creators of economic profit
Economics | Asia-Pacific
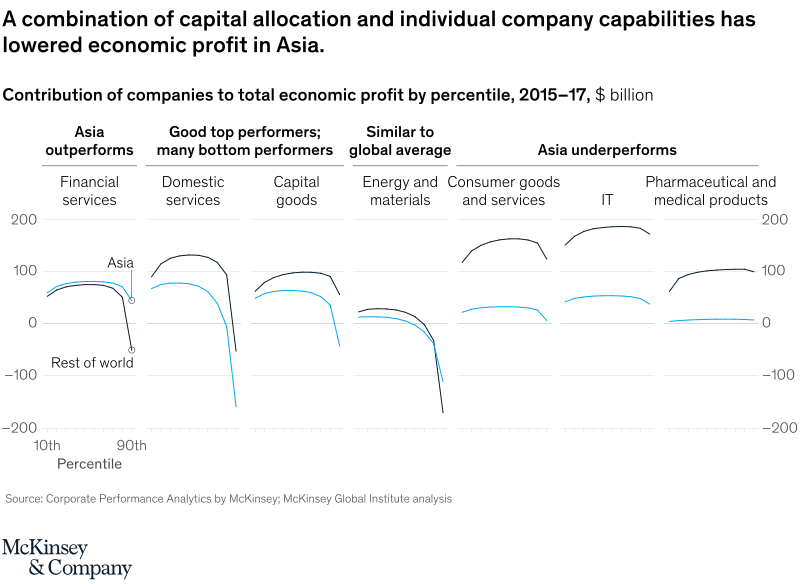
September 11, 2020 – When we analyzed the relative performance of all Global 5000 companies in generating economic profit, we found that financial companies in Asia outperform those in the rest of the world. But Asian companies underperform in several industries, and the continent has a higher concentration of companies that destroy economic value.
To read the discussion paper, see “The future of Asia: Decoding the value and performance of corporate Asia,” June 3, 2020.
customizer here
Visual form
Line Chart: small-multiple percentile curves comparing Asia with the rest of the world by industry.
Layout / body structure
Industry mini-panels are grouped under four headings: Asia outperforms, good top performers with many bottom performers, similar to global average, and Asia underperforms. Each panel compares the blue Asia curve with the black rest-of-world curve from lower to higher company percentiles.
What is being compared
It compares contribution to total economic profit for Asian companies versus companies in the rest of the world across industries including financial services, domestic services, capital goods, energy and materials, consumer goods and services, IT, and pharmaceutical and medical products.
Measurement system
The vertical scale is contribution to total economic profit in billions of dollars. The horizontal scale is company percentile, running from the 10th percentile through the 90th percentile.
Visible structure inside the graphic
Each mini-panel contains two curved lines. The right side of each panel shows top performers creating economic profit, while the left side shows bottom performers destroying value.
Main takeaway from the visual
The chart shows that Asia performs well in some sectors but is underrepresented among the strongest value creators in several major industries, especially where the rest-of-world curve rises far above Asia’s curve.
Key standout values or extremes
Financial services is the clearest Asia-outperformance panel. Consumer goods and services, IT, and pharmaceutical and medical products show the opposite pattern, with the rest-of-world curve much higher among top performers.
Controls / sequence, when applicable
This is a static small-multiple line chart; there are no in-chart controls to operate.
Companion media, when applicable
There is no separate companion audio or video; the economic-profit percentile chart is the full visual on this page.