Source page: McKinsey & Company
Commentary
Mobile-phone supply chains have become much more regionally concentrated
Supply Chain Management | Globalization
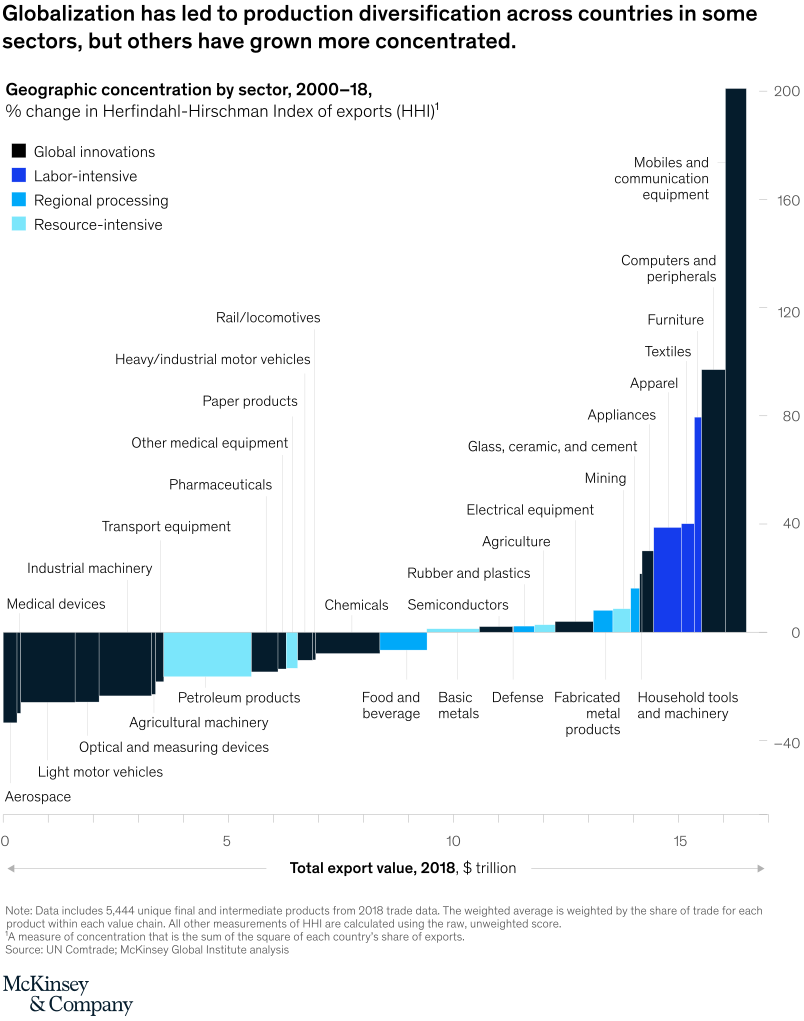
September 4, 2020 – In some sectors, suppliers may be concentrated in a single geography because of that country’s specialization and economies of scale. Some industries, such as mobile phones and communication equipment, have become more concentrated (particularly in China) in recent years, while others, including medical devices and aerospace, have become less so.
To read the report, see “Risk, resilience, and rebalancing in global value chains,” August 6, 2020.
customizer here
Visual form
Sorted sector bar chart.
Layout / body structure
The chart is a single sector ranking chart arranged from industries that became less geographically concentrated on the left to industries that became more concentrated on the right. Read across the sector labels while using the vertical scale to judge how far each bar moves away from the center toward diversification or concentration.
What is being compared
The chart compares changes in geographic concentration across export value chains by sector between 2000 and 2018. It contrasts industries such as mobiles and communication equipment, computers and peripherals, furniture, textiles, apparel, appliances, pharmaceuticals, other medical equipment, rail or locomotives, and mining.
Measurement system
The measure is percent change in the Herfindahl-Hirschman Index of exports. The vertical axis shows how much concentration changed, while the color legend groups sectors into value-chain types such as global innovations, labor-intensive, regional processing, and resource-intensive.
Visible structure inside the graphic
Each sector is represented by a vertical bar colored by value-chain type. The tallest positive bars appear on the right side of the chart, while sectors that became less concentrated sit to the left with lower or negative movement, making the whole chart read like a ranked spread from diversification toward concentration.
Main takeaway from the visual
The chart shows that production did not spread out evenly across the world. A few sectors became much more concentrated, with mobiles and communication equipment standing out dramatically above the rest, while a smaller set of sectors moved in the opposite direction and became less concentrated.
Key standout values or extremes
Mobiles and communication equipment is the most extreme positive case at roughly 200 percent change in export concentration. Computers and peripherals is the next major positive outlier around the 120 to 130 range, while furniture, textiles, apparel, and appliances also sit on the more concentrated side. On the less concentrated side, sectors such as rail or locomotives, heavy or industrial motor vehicles, paper products, other medical equipment, and pharmaceuticals appear to have moved leftward toward lower concentration.
Controls / sequence, when applicable
This is a static chart image with no in-chart controls to operate.
Companion media, when applicable
There is no separate companion audio or video; the chart image is the full visual on this page.