Source page: McKinsey & Company
Commentary
Advanced industries hurting more than others on several fronts
COVID-19 | Advanced industries
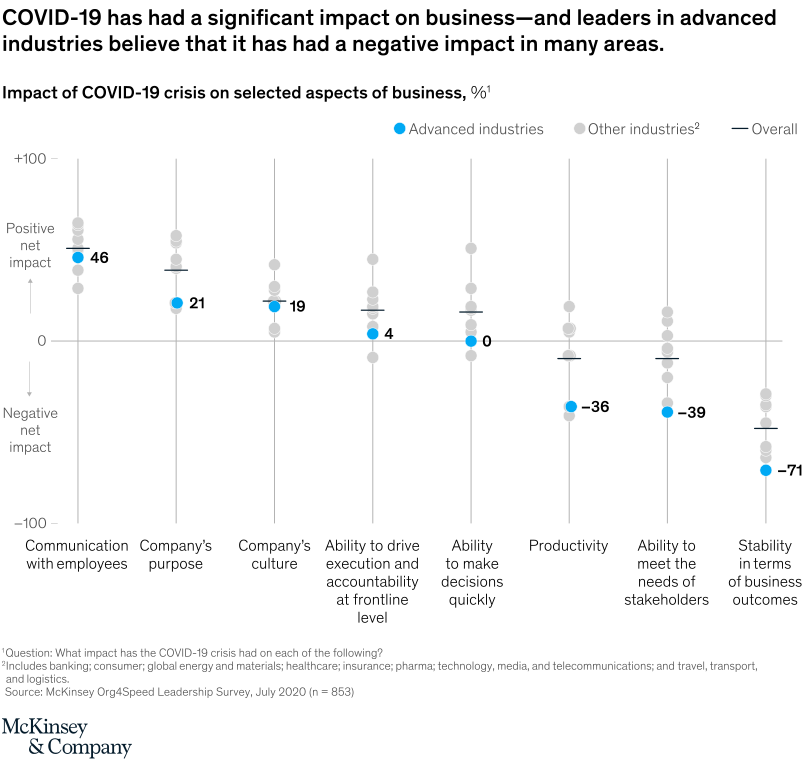
August 27, 2020 – Most striking has been the significant negative effect on business outcomes for companies in advanced industries—a group that includes automotive, aerospace, advanced electronics, and machinery players.
To read the article, see “Organizing for speed in advanced industries,” August 20, 2020.
customizer here
Visual form
Scatter Plot: categorical dot plot of COVID-19 business-impact scores by industry group.
Layout / body structure
Each business aspect forms a vertical lane. Blue markers show advanced industries, gray markers show other industries, and a dark reference marker shows the overall level for that aspect.
What is being compared
It compares net perceived COVID-19 impact across communication, purpose, culture, execution, decision speed, productivity, stakeholder needs, and stability of business outcomes.
Measurement system
The vertical scale is percent net impact, with positive values above the baseline and negative values below it. Marker position shows whether each business aspect improved or worsened.
Visible structure inside the graphic
Advanced industries sit positive on communication, purpose, and culture, then move toward neutral on execution and decision speed. The same blue markers fall sharply negative for productivity, stakeholder needs, and business-outcome stability.
Main takeaway from the visual
The chart shows that advanced-industries leaders saw mixed operational effects from COVID-19: some internal alignment improved, but core business outcomes deteriorated sharply.
Key standout values or extremes
Advanced industries show plus 46 for communication with employees and minus 71 for stability of business outcomes. Productivity is minus 36, and ability to meet stakeholder needs is minus 39.
Controls / sequence, when applicable
This is a static dot-plot scatter chart; there are no in-chart controls to operate.
Companion media, when applicable
There is no separate companion audio or video; the business-impact dot plot is the full visual on this page.