Source page: McKinsey & Company
Commentary
Up to $4.6 trillion in industrial trade flows could be rebalanced across geographies
COVID-19 | Supply Chain Management | Global Trade
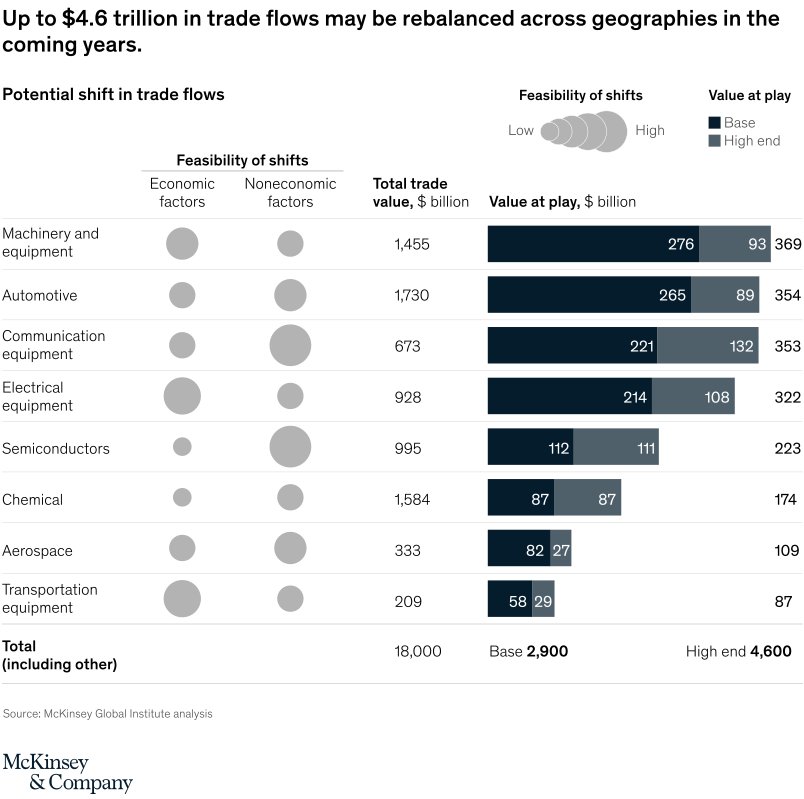
August 24, 2020 – The shifts might be driven by a variety of economic factors (capital intensity, an educated workforce, product complexity, and trade-weighted distance) and noneconomic factors (state interventions intended to further national security, national competitiveness, and self-sufficiency).
To read the article, see “Reimagining industrial supply chains,” August 11, 2020.
customizer here
Visual form
Table (with Visual Encoding): sector trade-flow table with feasibility bubbles and value-at-play bars.
Layout / body structure
Each row is an industry. The left side names the sector and shows economic and noneconomic feasibility with bubble marks, while the right side shows total trade value and value at play under base and high-end scenarios.
What is being compared
It compares how much industrial trade could shift across geographies by sector, including machinery and equipment, automotive, communication equipment, electrical equipment, semiconductors, chemicals, aerospace, and transportation equipment.
Measurement system
Trade value and value at play are measured in billions of dollars. Bubble marks encode relative feasibility, and the right-side bars encode the scale of trade value exposed to rebalancing.
Visible structure inside the graphic
The largest value-at-play bars appear in machinery and equipment, automotive, communication equipment, and electrical equipment. Smaller sectors still carry meaningful shift potential but occupy shorter rows on the value scale.
Main takeaway from the visual
The chart shows that rebalancing is not evenly distributed across industrial supply chains. A few large sectors account for much of the dollar value, while feasibility differs by both economic and noneconomic factors.
Key standout values or extremes
The total value at play is 2.9 trillion dollars in the base case and 4.6 trillion dollars at the high end. Machinery and equipment shows 369 billion dollars at play, automotive 354 billion dollars, and communication equipment 353 billion dollars.
Controls / sequence, when applicable
This is a static visually encoded table; there are no in-chart controls to operate.
Companion media, when applicable
There is no separate companion audio or video; the industrial trade-flow table is the full visual on this page.