Source page: McKinsey & Company
Commentary
Governments face a $30 trillion fiscal gap by 2023
COVID-19 | Public Sector
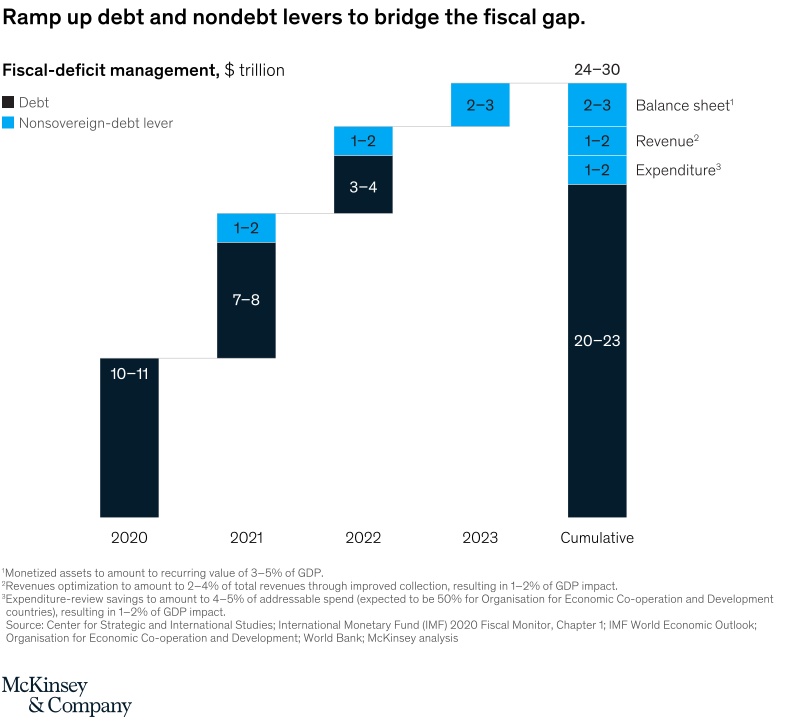
July 30, 2020 – Governments most likely will finance 80 to 90 percent of the estimated $30 trillion fiscal gap through conventional debt, but a thoughtful approach to balance-sheet funding, revenue-stream optimization, and the containment of spending could give them medium- to long-term support in funding the additional debt burden accumulated during the COVID-19 crisis.
To read the article, see “Closing the $30 trillion gap: Acting now to manage fiscal deficits during and beyond the COVID-19 crisis,” July 16, 2020.
customizer here
Visual form
Stacked Bar / Stacked Column: fiscal-gap funding bars split by debt and nondebt levers.
Layout / body structure
The chart shows annual bars from 2020 through 2023 and a rightmost cumulative bar. Each bar separates conventional debt from nonsovereign-debt levers, and the cumulative bar breaks the total into debt, expenditure, revenue, and balance-sheet components.
What is being compared
It compares how governments could bridge the fiscal gap using debt and nondebt levers over multiple years. The chart emphasizes the cumulative funding mix needed by 2023.
Measurement system
All values are measured in trillions of dollars. Stacked segments show how each funding source contributes to the annual or cumulative total.
Visible structure inside the graphic
Debt dominates the cumulative column, while nondebt levers add smaller blue segments above it. The cumulative bar reaches the 24 trillion to 30 trillion dollar range.
Main takeaway from the visual
The chart shows that governments face a massive fiscal gap and will rely mostly on debt, but nondebt levers still matter because they can reduce pressure on public balance sheets.
Key standout values or extremes
The cumulative column shows 20 trillion to 23 trillion dollars of debt plus additional 1 trillion to 2 trillion dollar and 2 trillion to 3 trillion dollar nondebt levers, reaching about 24 trillion to 30 trillion dollars total.
Controls / sequence, when applicable
This is a static stacked-column chart; there are no in-chart controls to operate.
Companion media, when applicable
There is no separate companion audio or video; the fiscal-gap stacked-column chart is the full visual on this page.