Source page: McKinsey & Company
Commentary
Summer in the Northern Hemisphere keeps getting hotter
Climate change | North America
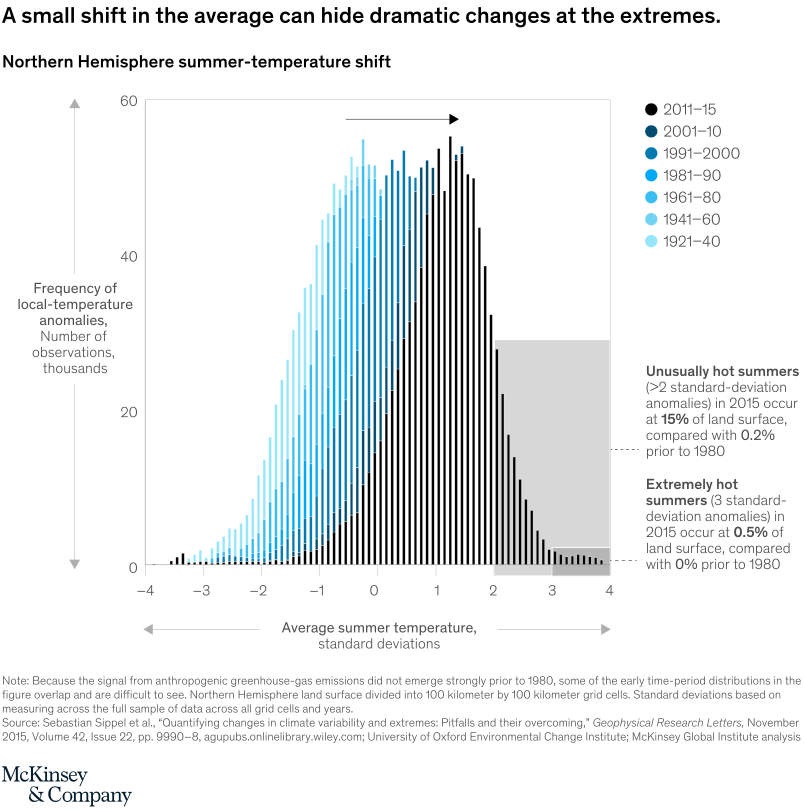
July 16, 2020 – The average day in many locations is now hotter, and extremely hot days are becoming more likely. The share of the Northern Hemisphere that experiences an unusually hot summer has increased to 15.0 percent, from 0.2 percent, since 1980.
To read the report, see “Climate risk and response: Physical hazards and socioeconomic impacts,” January 16, 2020.
customizer here
Visual form
Histogram-style distribution of Northern Hemisphere summer-temperature anomalies by time period.
Layout / body structure
Bars are colored by historical periods from 1921-1940 through 2011-2015. The distribution moves rightward over time, with shaded regions identifying unusually hot and extremely hot summers.
What is being compared
It compares the frequency of local summer-temperature anomalies across successive historical periods in the Northern Hemisphere.
Measurement system
The horizontal axis is average summer temperature in standard deviations. The vertical axis is frequency of local-temperature anomalies measured as number of observations in thousands.
Visible structure inside the graphic
Older period colors cluster closer to the center and left, while recent period bars concentrate farther to the right. The gray extreme-hot region becomes much more relevant in recent decades.
Main takeaway from the visual
A small shift in the average temperature distribution hides a major change at the extremes: unusually and extremely hot summers have become much more common.
Key standout values or extremes
The annotation notes that extremely hot summers in 2015 occurred on 0.5 percent of land surface, compared with 0 percent before 1980. Unusually hot summers reached 15 percent of land surface in 2015, compared with 0.2 percent before 1980.
Controls / sequence, when applicable
This is a static chart image with no in-chart controls to operate.
Companion media, when applicable
There is no separate companion audio or video; the chart image is the full visual on this page.