Source page: McKinsey & Company
Commentary
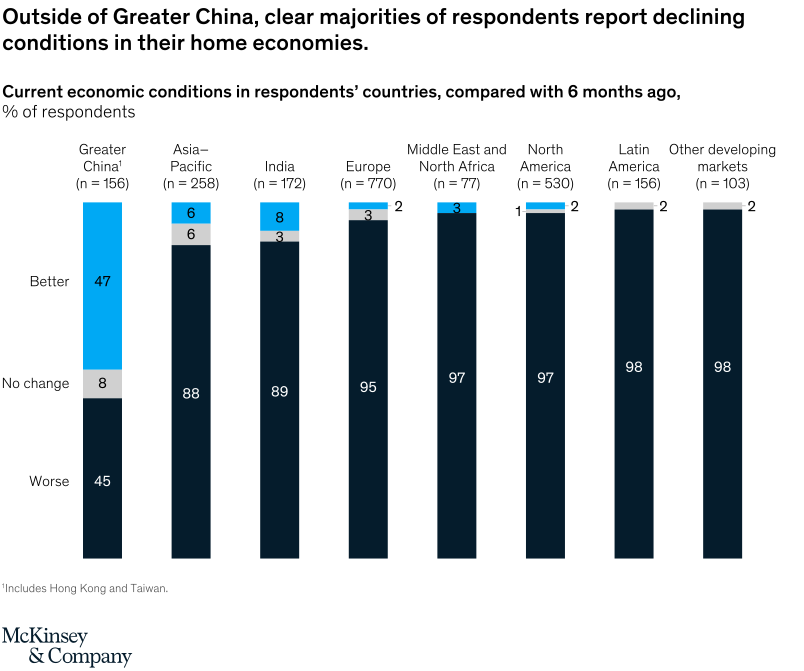
Nearly nine in ten executives say home economies are worse now than six months ago
COVID-19 | Economy | China
July 2, 2020 – The only exception is Greater China, where 45 percent of respondents say the economy is worse now, and 47 percent say conditions have improved in recent months.
To read the survey, see “Economic Conditions Snapshot, June 2020: McKinsey Global Survey results,” June 30, 2020.
customizer here
Visual form
Stacked Bar / Stacked Column: regional executive-sentiment bars for current economic conditions.
Layout / body structure
Each region is represented by one vertical stacked column. The column segments divide respondents into worse, no change, and better views of their home economy compared with six months earlier.
What is being compared
It compares executives’ assessments of current economic conditions across regions. The chart highlights how Greater China differs from other regions in the balance of worse versus better responses.
Measurement system
The measure is percent of respondents in each region. Each stacked column sums to 100 percent across worse, no change, and better responses.
Visible structure inside the graphic
Outside Greater China, the dark worse segment dominates nearly every bar. Greater China is the visual exception, with a large blue better segment and a much smaller worse share than other regions.
Main takeaway from the visual
The chart shows that executives almost everywhere saw their home economies as worse than six months earlier, while Greater China had a much more balanced and comparatively positive response pattern.
Key standout values or extremes
Europe shows 95 percent worse, North America 97 percent worse, Latin America 98 percent worse, and other developing markets 98 percent worse. Greater China is the exception, with 47 percent saying better.
Controls / sequence, when applicable
This is a static stacked-column chart; there are no in-chart controls to operate.
Companion media, when applicable
There is no separate companion audio or video; the stacked-column chart is the full visual on this page.