Source page: McKinsey & Company
Commentary
COVID-19’s hit to Europeans’ happiness costlier than continent’s GDP losses
COVID-19 | Europe
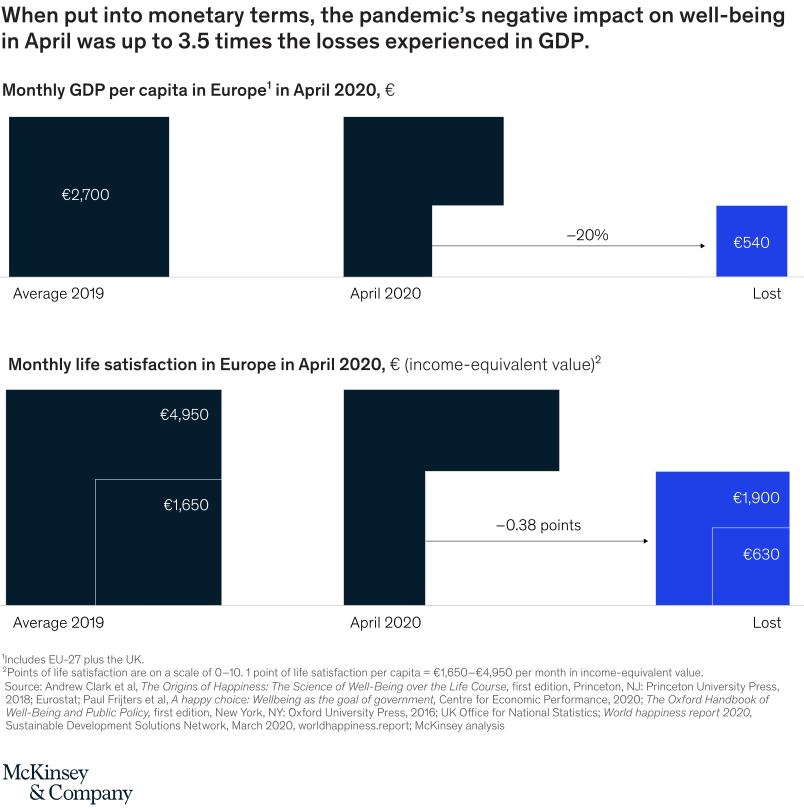
June 24, 2020 – Our modeling of the drivers of well-being, along with the large and growing literature on “happiness economics,” helped us determine that the 0.38-point drop in Europeans’ life satisfaction (on a ten-point scale) during April translated into the equivalent of up to 3.5 times the continent’s reduction in income per capita.
To read the article, see “Well-being in Europe: Addressing the high cost of COVID-19 on life satisfaction,” June 9, 2020.
customizer here
Visual form
Waterfall Chart: two-panel monetary bridge comparing GDP loss with life-satisfaction loss.
Layout / body structure
The chart has two stacked panels. The top panel bridges from average 2019 monthly GDP per capita to the April 2020 loss, and the lower panel translates the drop in life satisfaction into an income-equivalent monthly loss.
What is being compared
It compares the pandemic’s measured GDP-per-capita loss with the monetary equivalent of lost well-being in Europe. The lower panel reframes a life-satisfaction decline so it can be compared directly with the GDP loss.
Measurement system
Both panels are expressed in euros per month. The life-satisfaction panel converts a change on a 0-to-10 satisfaction scale into an income-equivalent monthly value.
Visible structure inside the graphic
The GDP panel shows a 540 euro monthly loss from a 2,700 euro baseline. The life-satisfaction panel shows a much larger 1,900 euro income-equivalent loss, with a smaller GDP-loss marker shown for comparison.
Main takeaway from the visual
The chart shows that the well-being cost of COVID-19 was much larger than the GDP loss when both are translated into monetary terms. The life-satisfaction decline is the dominant visual feature.
Key standout values or extremes
Monthly GDP per capita falls 20 percent, from 2,700 euros to a 540 euro loss. The life-satisfaction panel shows a 1,900 euro income-equivalent loss, about 3.5 times the GDP loss.
Controls / sequence, when applicable
This is a static waterfall-style comparison; there are no in-chart controls to operate.
Companion media, when applicable
There is no separate companion audio or video; the two-panel waterfall chart is the full visual on this page.