Source page: McKinsey & Company
Commentary
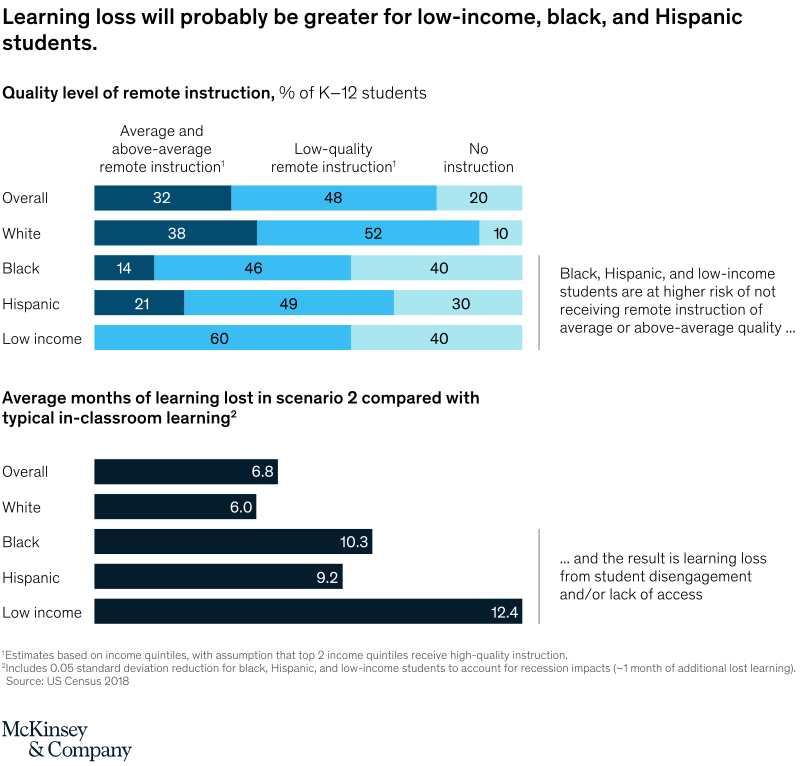
30-40 percent of minority and low-income students weren’t learning during lockdowns
COVID-19 | Education | Inequality
June 15, 2020 – In comparison, the share of white students not receiving remote instruction was only 10 percent. And only 32 percent of all students were getting instruction that was average or better, which will translate into months of lost learning.
To read the article, see “COVID-19 and student learning in the United States: The hurt could last a lifetime,” June 1, 2020.
customizer here
Visual form
Combined stacked-bar and horizontal-bar chart.
Layout / body structure
The upper section stacks remote-instruction quality by student group. The lower section uses horizontal bars to estimate months of learning lost by group under scenario 2.
What is being compared
It compares remote-instruction quality and learning-loss estimates for overall, white, Black, Hispanic, and low-income K-12 students.
Measurement system
The upper bars show percent of students receiving average-or-better, low-quality, or no remote instruction. The lower bars show average months of learning lost compared with typical in-classroom learning.
Visible structure inside the graphic
Black, Hispanic, and low-income students have much larger no-instruction segments than white students. The lower bars extend farther for low-income, Black, and Hispanic students than for the overall and white groups.
Main takeaway from the visual
Learning loss was likely greater for low-income, Black, and Hispanic students because those groups were less likely to receive adequate remote instruction during lockdowns.
Key standout values or extremes
The no-instruction share is 40 percent for Black students and 40 percent for low-income students, versus 10 percent for white students. Estimated learning loss reaches 12.4 months for low-income students, 10.3 for Black students, and 9.2 for Hispanic students.
Controls / sequence, when applicable
This is a static chart image with no in-chart controls to operate.
Companion media, when applicable
There is no separate companion audio or video; the chart image is the full visual on this page.