Source page: McKinsey & Company
Commentary
Jobs at smallest US businesses most vulnerable to crisis
COVID-19 | Jobs | North America
May 21, 2020 – As US unemployment claims continue to rise, the hardest hit are workers at companies with fewer than 100 employees.
To read the article, see “COVID-19’s effect on jobs at small businesses in the United States,” May 5, 2020.
customizer here
Visual form
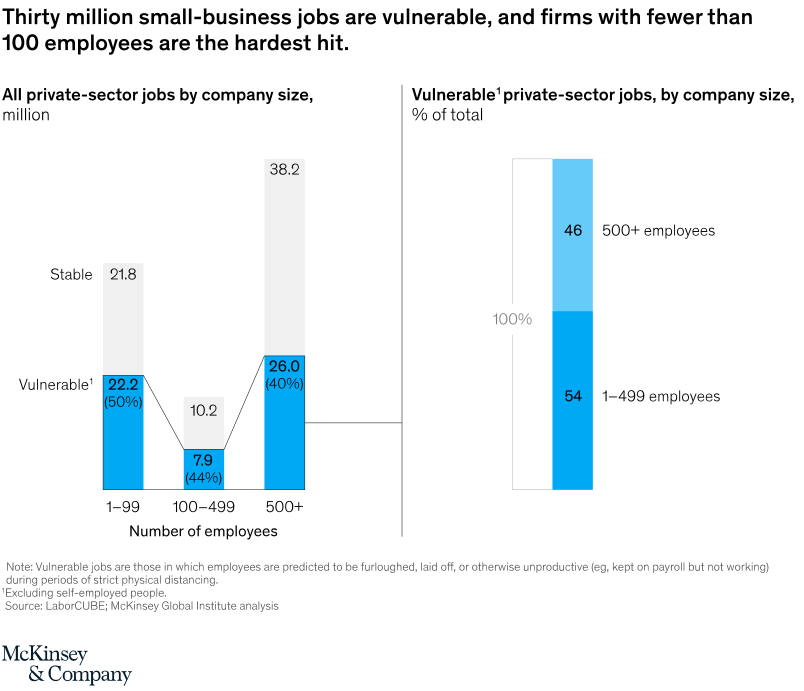
Bar Chart and Stacked Bar / Stacked Column: US vulnerable jobs by employer-size group.
Layout / body structure
The visual has two linked parts. The left side uses vertical bars to compare total private-sector jobs and vulnerable jobs across employer-size bands, while the right side uses a stacked composition bar to show how vulnerable jobs are distributed by employer size.
What is being compared
It compares US private-sector jobs at firms with 1 to 99 employees, 100 to 499 employees, and 500 or more employees. Within those groups, it separates jobs vulnerable to furlough, layoff, or reduced work from the broader job base.
Measurement system
The left chart measures jobs in millions and labels the vulnerable share within each employer-size group. The right stacked bar measures percent of vulnerable private-sector jobs by employer-size category.
Visible structure inside the graphic
The smallest-firm group has a large vulnerable segment relative to its total employment bar. The largest-firm group has more total jobs, but its vulnerable share is lower, and the right-side composition bar shows vulnerable jobs split across small and larger employers.
Main takeaway from the visual
The chart shows why the smallest businesses were especially exposed in the crisis. Firms with fewer than 100 employees had the highest vulnerable-job share, even though large employers also represented a major absolute number of vulnerable jobs.
Key standout values or extremes
The 1 to 99 employee group shows 22.2 million vulnerable jobs, equal to 50 percent of that group. The 500-plus employee group shows 26.0 million vulnerable jobs, but that represents 40 percent of its group.
Controls / sequence, when applicable
This is a static set of bar charts; there are no in-chart controls to operate.
Companion media, when applicable
There is no separate companion audio or video; the bar-chart comparison is the full visual on this page.