Source page: McKinsey & Company
Commentary
What Europe’s lockdown shopping looks like
COVID-19 | Europe | Digital
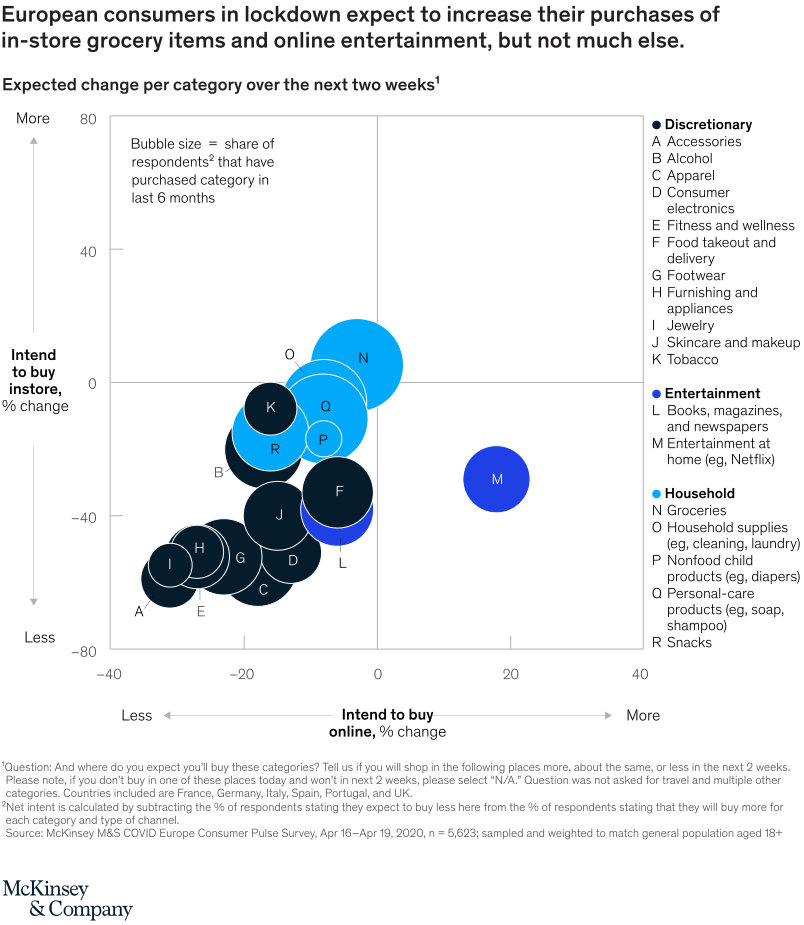
May 20, 2020 – Our consumer-sentiment surveys in mid-April suggested that European shoppers expected to spend less on everything except groceries and online entertainment while largely confined to their homes.
To read the article, see “How European businesses can position themselves for recovery,” April 2020.
customizer here
Visual form
Scatter Plot: bubble scatter plot of European shopping intent by store and online channel.
Layout / body structure
Product categories are plotted in one scatter field. The horizontal axis shows intended change in online buying, the vertical axis shows intended change in store buying, and bubble size shows how many respondents bought the category recently.
What is being compared
It compares expected near-term shopping shifts across European consumer categories, including groceries, household supplies, apparel, furniture, entertainment, restaurants, and tobacco. The chart separates the store-channel change from the online-channel change for each category.
Measurement system
Both axes are percent change in intended buying over the next two weeks. Bubble area represents the share of respondents who purchased the category in the past three to six months.
Visible structure inside the graphic
Most category bubbles sit below zero on the store-buying axis, showing weaker in-store intent during lockdown. Only a few categories move strongly rightward for online buying, with entertainment and groceries standing apart from many discretionary categories.
Main takeaway from the visual
The chart shows that lockdown did not simply move all spending online. Consumers expected to cut back across many categories, with online entertainment and grocery-related buying as the clearest positive exceptions.
Key standout values or extremes
Entertainment sits farthest to the right among the online-intent categories, while many discretionary categories cluster in negative store-buying territory. Grocery is one of the most visible positive exceptions because it combines high recent purchasing with stronger lockdown demand.
Controls / sequence, when applicable
This is a static scatter plot; there are no in-chart controls to operate.
Companion media, when applicable
There is no separate companion audio or video; the bubble scatter plot is the full visual on this page.