Source page: McKinsey & Company
Commentary
Technology helped shape Asia’s early response to COVID-19
COVID-19 | Asia | Technology
May 19, 2020 – Six digital and mobile technologies that helped guide governments and businesses in Asia could help other countries around the world.
To read the article, see “How technology is safeguarding health and livelihoods in Asia,” May 12, 2020.
customizer here
Visual form
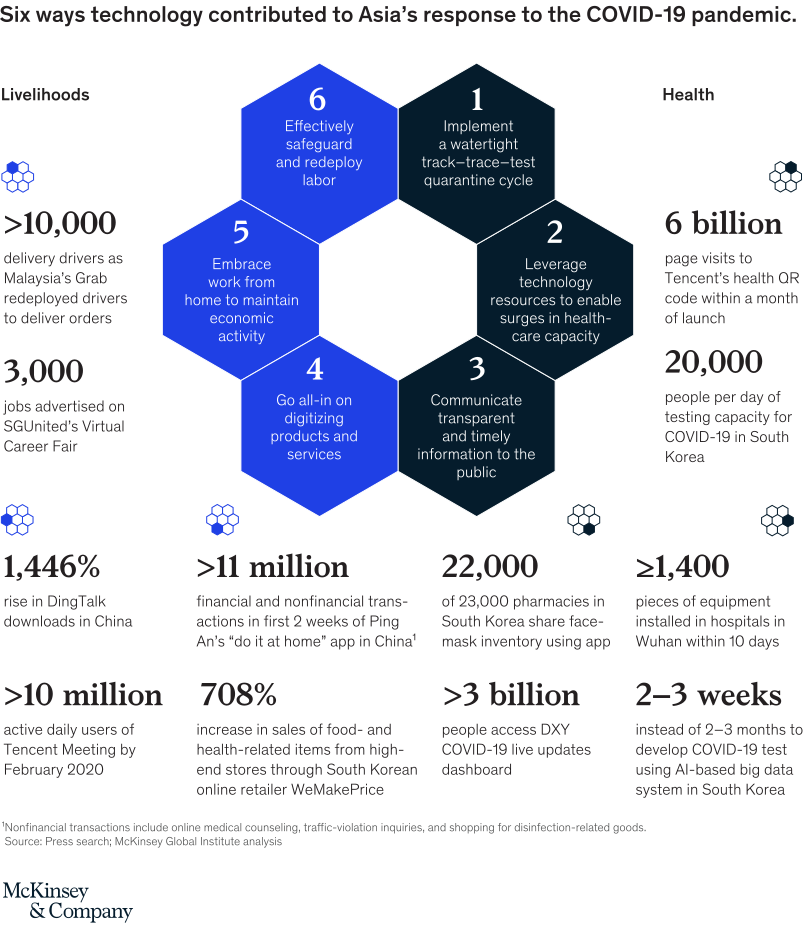
Table (with Visual Encoding): six-part technology-response infographic with KPI callouts.
Layout / body structure
The graphic is organized around six numbered hexagons, each naming a technology-enabled COVID-19 response in Asia. Around the central sequence, large numeric callouts provide evidence for the scale or speed of the response.
What is being compared
It compares six uses of digital and mobile technology: quarantine enforcement, healthcare access, public communication, digital services, remote work, and supply-chain or capacity redeployment. The comparison is qualitative by response type and quantitative through the supporting callouts.
Measurement system
The measures are not one shared axis. They include visits, transactions, downloads, pharmacies, hospital beds, and deployment time, so the visual works as a table with visual encoding and KPI evidence rather than a single-scale chart.
Visible structure inside the graphic
The numbered hexagons create the main reading path, while surrounding callouts attach specific evidence to the response mechanisms. The design uses large numbers to show scale and smaller explanatory text to connect each number to a technology use case.
Main takeaway from the visual
Technology helped Asia’s early COVID-19 response across several operating fronts at once. The visual shows digital tools supporting public communication, health monitoring, logistics, service delivery, and emergency capacity rather than a single isolated intervention.
Key standout values or extremes
Standout callouts include 6 billion visits to Tencent’s health QR code, more than 11 million financial and nonfinancial transactions in two weeks, more than 3 billion accesses to COVID-19 updates, and 2 to 3 weeks to install hospital beds in South Korea.
Controls / sequence, when applicable
This is a static table-style infographic with visual encoding; there are no in-chart controls to operate.
Companion media, when applicable
There is no separate companion audio or video; the infographic is the full visual on this page.