Source page: McKinsey & Company
Commentary
COVID-19 may be claiming more lives than we think
COVID-19 | Public Health
May 14, 2020 – More people are dying this year than in 2019, but it’s unclear whether that’s related to undiagnosed COVID-19 cases or to other causes.
To read the article, see “COVID-19: Briefing note, May 13, 2020.”
customizer here
Visual form
Stacked Bar / Stacked Column: excess-mortality columns comparing confirmed COVID-19 deaths with additional deaths.
Layout / body structure
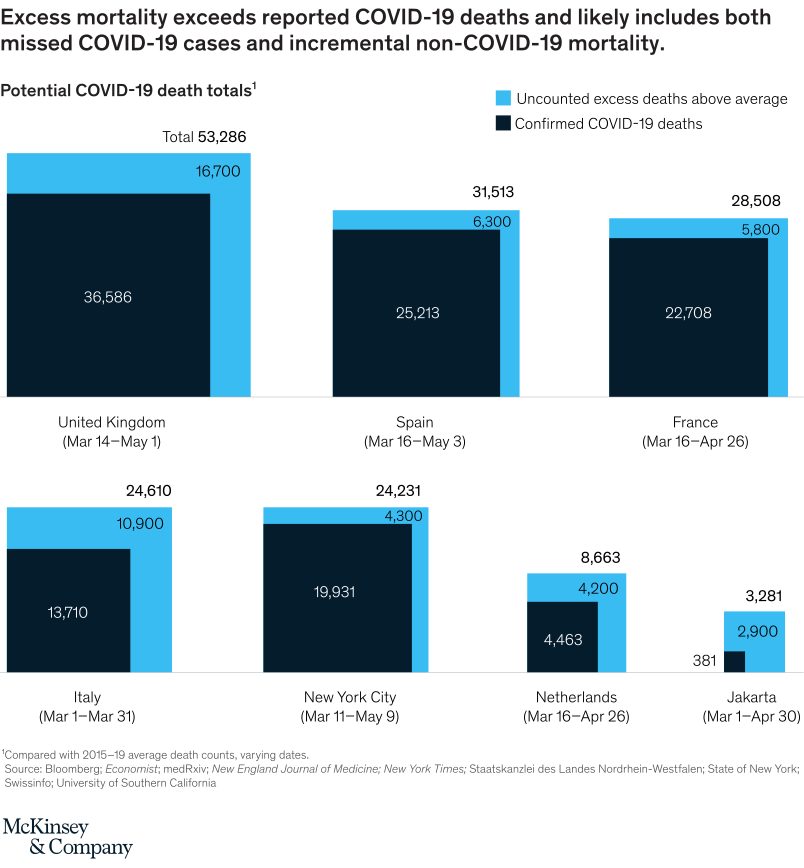
Each place is shown as a vertical stacked column. The lower segment is confirmed COVID-19 deaths, the upper segment is excess deaths above average that were not counted as confirmed COVID-19 deaths, and each full column gives the potential mortality total for that place.
What is being compared
It compares reported COVID-19 deaths with broader excess mortality across the United Kingdom, Spain, France, Italy, New York City, the Netherlands, and Jakarta. The comparison shows both the confirmed count and the possible uncounted mortality burden.
Measurement system
The measure is death counts over the date ranges shown for each location. Stacked column height represents the combined total of confirmed COVID-19 deaths plus additional excess deaths above the expected average.
Visible structure inside the graphic
Every location has an upper excess-death segment above the confirmed-death base. The United Kingdom has the tallest total column, while Jakarta has a small confirmed-death base and a much larger excess-death segment.
Main takeaway from the visual
The chart shows that official COVID-19 death counts likely understated the full mortality impact. Excess deaths above the confirmed totals point to missed COVID-19 cases, indirect crisis mortality, or both.
Key standout values or extremes
The United Kingdom total is labeled 53,286, made up of 36,586 confirmed deaths and 16,700 excess deaths. Jakarta shows 381 confirmed deaths versus 2,900 excess deaths, making the uncounted portion especially large relative to the confirmed base.
Controls / sequence, when applicable
This is a static stacked-column chart; there are no in-chart controls to operate.
Companion media, when applicable
There is no separate companion audio or video; the stacked-column chart is the full visual on this page.