Source page: McKinsey & Company
Commentary
A $247 billion opportunity
Healthcare | Innovation
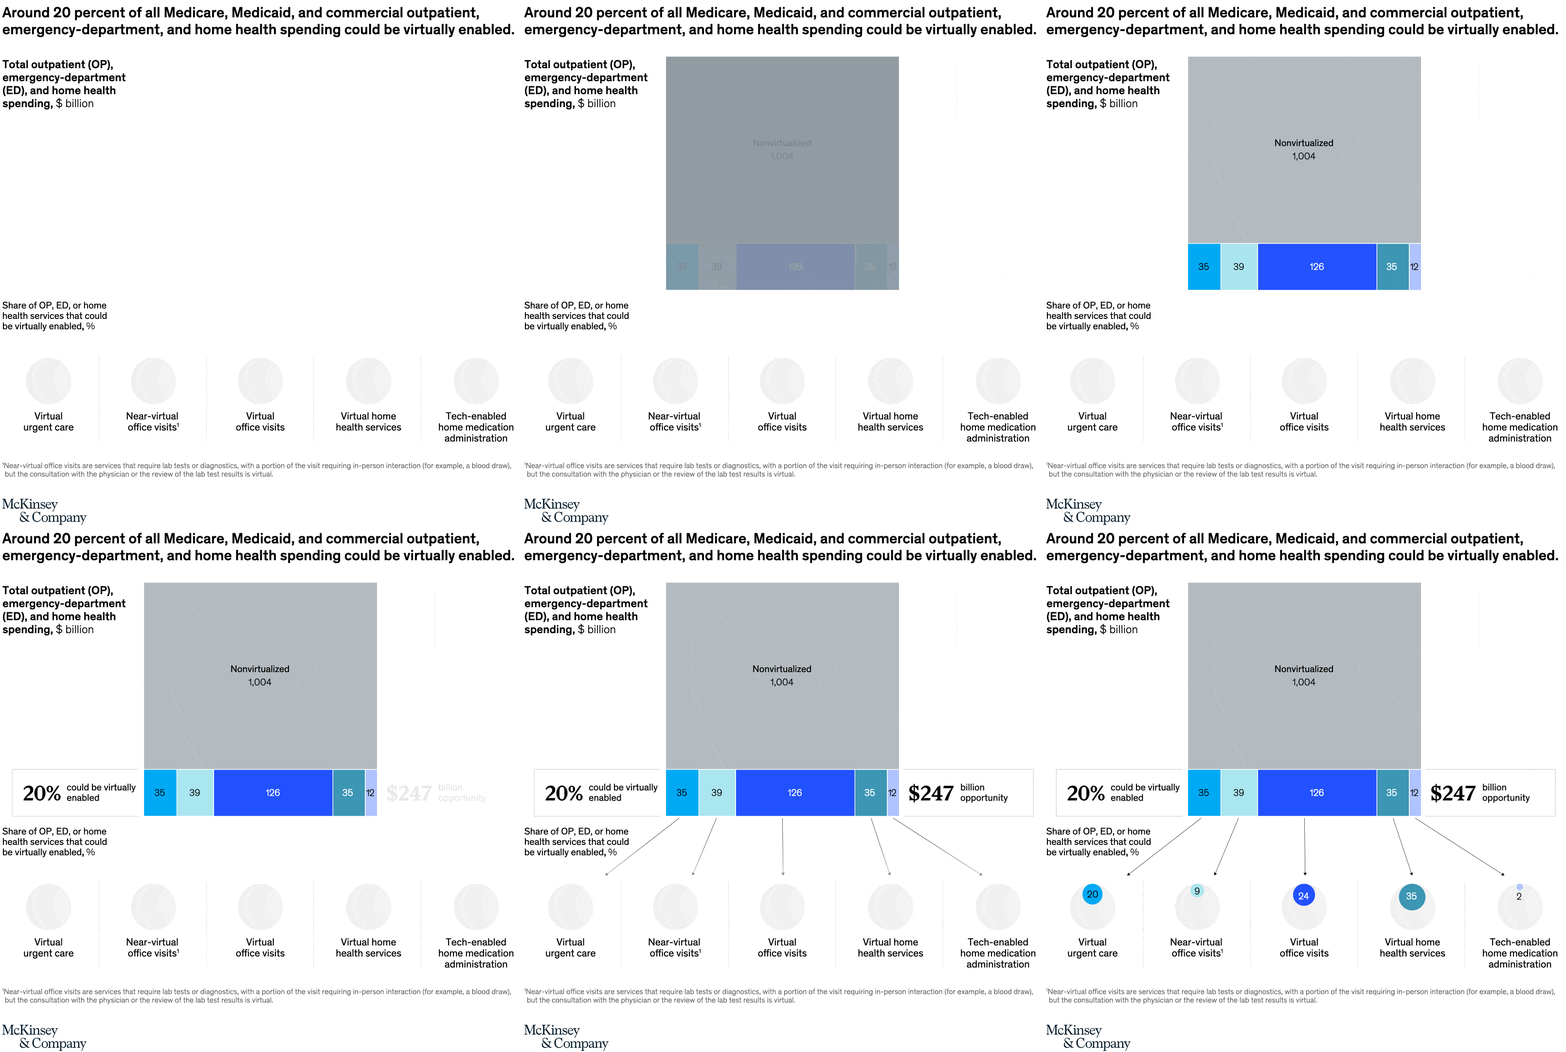
April 18, 2022 – Going virtual could equate to a big shift in spending in healthcare services. Consumers continue to embrace virtual health, and with ongoing investment in innovation, we estimate that around $250 billion in outpatient spend could potentially be shifted to virtual settings for home health services, office visits, and urgent care.
To read the article, see “The next frontier of care delivery in healthcare,” March 24, 2022.
customizer here
Visual form
Healthcare-spending opportunity block chart with a service-share bubble row.
Layout / body structure
The chart has one large spending block at the center, a thin colored strip along its bottom edge, and a row of service circles underneath connected by leader lines. Read the overall opportunity first from the central spending block, then move down through the five service categories to see how the virtually enabled share breaks out by use case.
What is being compared
The page compares total outpatient, emergency-department, and home-health spending that remains nonvirtualized with the portion that could be virtually enabled. It also compares how much of that virtualizable share sits in virtual urgent care, near-virtual office visits, virtual office visits, virtual home health services, and tech-enabled home medication administration.
Measurement system
The large central rectangle is measured in billions of dollars, with the gray block showing nonvirtualized spending and the colored strip showing the virtualizable portion. The lower row uses percentage shares for each service category, while the right-hand callout summarizes the combined dollar opportunity.
Visible structure inside the graphic
Most of the central block is a large gray rectangle labeled nonvirtualized, and only a narrow multicolored band along the bottom is marked as the virtualizable slice. Beneath it, five circles of different sizes and labels are aligned under the strip, which lets the reader connect each segment of the dollar band to its corresponding service share.
Main takeaway from the visual
The chart argues that the opportunity is substantial even though the virtualizable slice is still a minority of total spending. The narrow bottom band shows that only part of the total market can be virtualized, but the band is still large enough in dollar terms to produce a very large right-hand opportunity figure.
Key standout values or extremes
The headline callouts say that 20 percent of spending could be virtually enabled and that this represents a 247 billion dollar opportunity. Inside the colored band, the largest category is virtual office visits at 126 billion dollars, followed by near-virtual office visits at 39, virtual urgent care at 35, virtual home health services at 35, and tech-enabled home medication administration at 12; the lower share row shows 24 percent for virtual office visits, 35 percent for virtual home health services, 20 percent for virtual urgent care, 9 percent for near-virtual office visits, and 2 percent for tech-enabled home medication administration.
Controls / sequence, when applicable
This is a static chart image with no in-chart controls to operate.
Companion media, when applicable
There is no separate companion audio or video; the chart image is the full visual on this page.