Source page: McKinsey & Company
Commentary
A banking boost for Latino customers
Financial services | Diversity & Inclusion
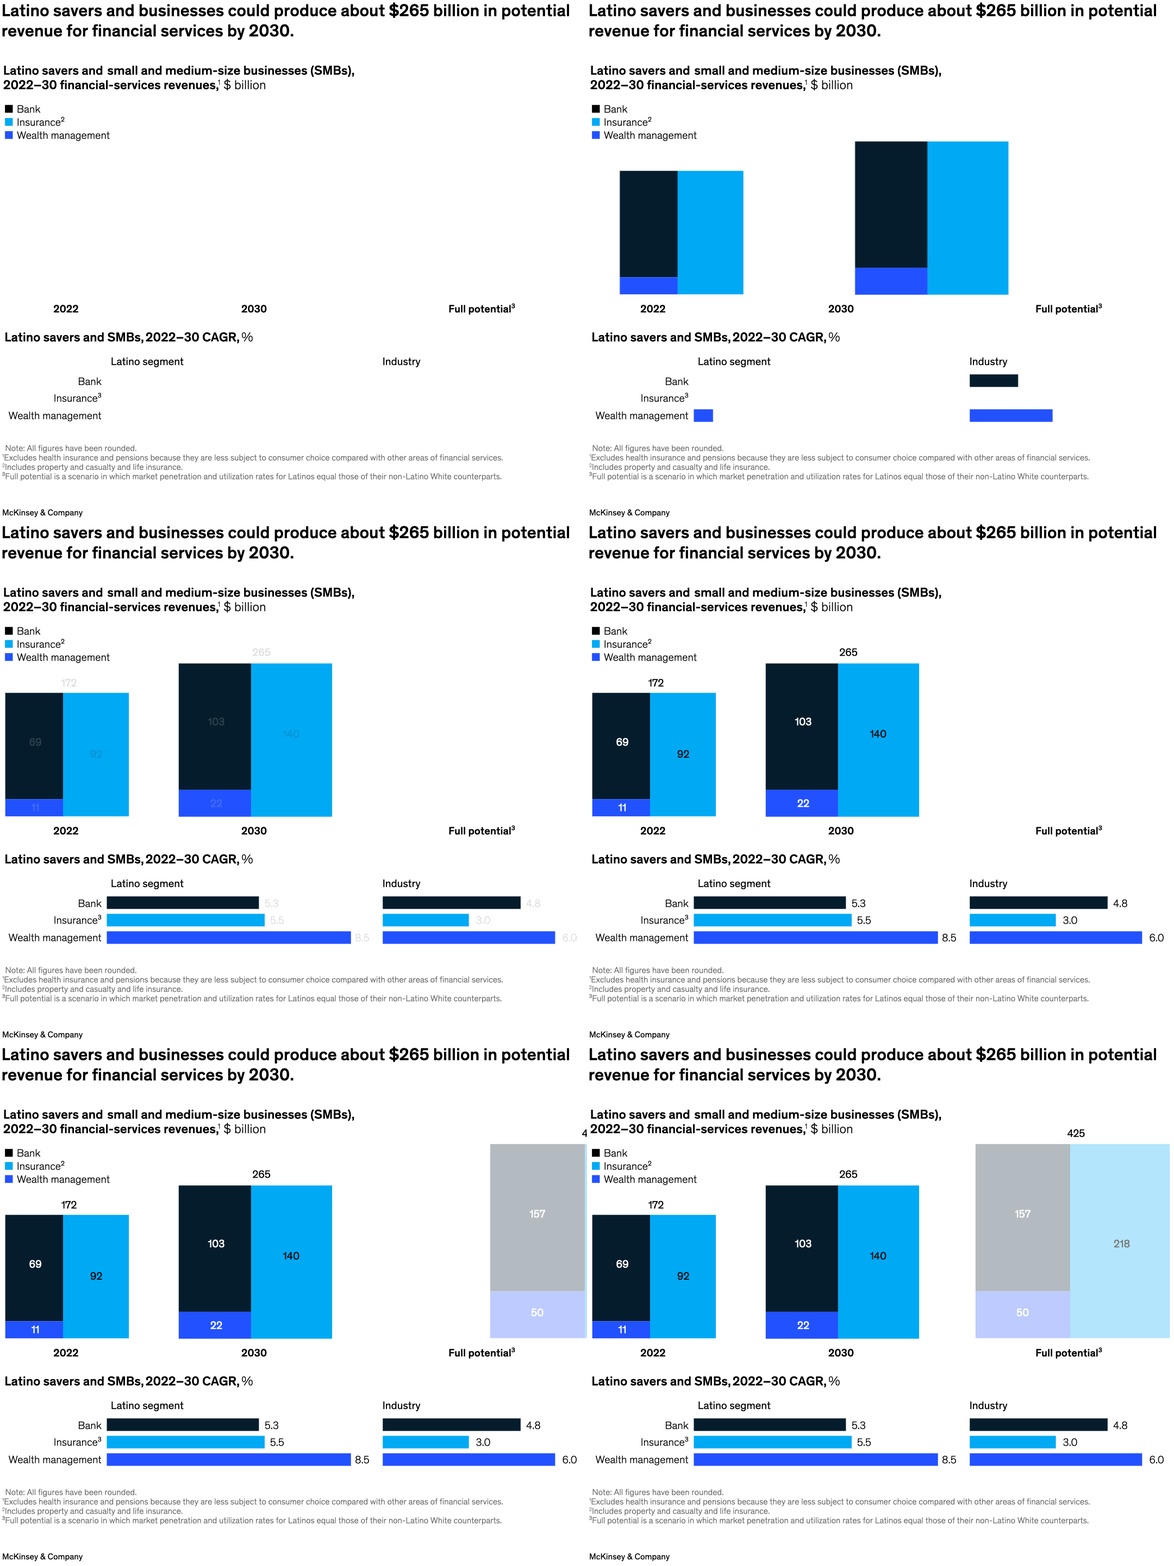
January 25, 2024 – In the United States, Latinos historically have not had access to many of the benefits of financial services, which has contributed to persistent inequalities. But there’s an opportunity for institutions to better serve customers and boost revenues, find senior partner Lucy Pérez and colleagues. For example, our analysis shows that revenue from Latino households (whom we refer to as savers) and from small and medium-size businesses in the financial-services market could grow from $170 billion in 2022 to approximately $265 billion by 2030.
To read the report, see “The economic state of Latinos in America: Advancing financial growth,” December 11, 2023.
customizer here
Visual form
Stacked bar chart paired with CAGR comparison bars.
Layout / body structure
The top row shows three large stacked revenue columns for 2022, 2030, and full potential, and the lower row compares CAGR for the Latino segment against the broader industry.
What is being compared
It compares Latino savers and small and medium-size businesses by financial-services revenue segment and also compares projected growth rates against the industry baseline.
Measurement system
The top section is measured in billions of dollars and the bottom section in CAGR percentages.
Visible structure inside the graphic
Each top bar is split into bank, insurance, and wealth-management segments with the values printed inside, while the bottom uses paired horizontal bars for Latino-segment and industry growth by segment.
Main takeaway from the visual
The revenue pool grows materially under the base 2030 case and becomes much larger again under the full-potential scenario, while Latino-segment growth also outpaces industry growth in each line of business shown.
Key standout values or extremes
The total rises from 172 in 2022 to 265 in 2030 and to 425 at full potential; bank revenue goes from 69 to 103, insurance from 92 to 140, wealth management from 11 to 22, and the CAGR comparisons are 5.3 versus 4.8 for bank, 5.5 versus 3.0 for insurance, and 8.5 versus 6.0 for wealth management.
Controls / sequence, when applicable
This is a static chart image with no in-chart controls to operate.
Companion media, when applicable
There is no separate companion audio or video; the chart image is the full visual on this page.