Source page: McKinsey & Company
Commentary
A booming insurance market
Financial services | Latin America
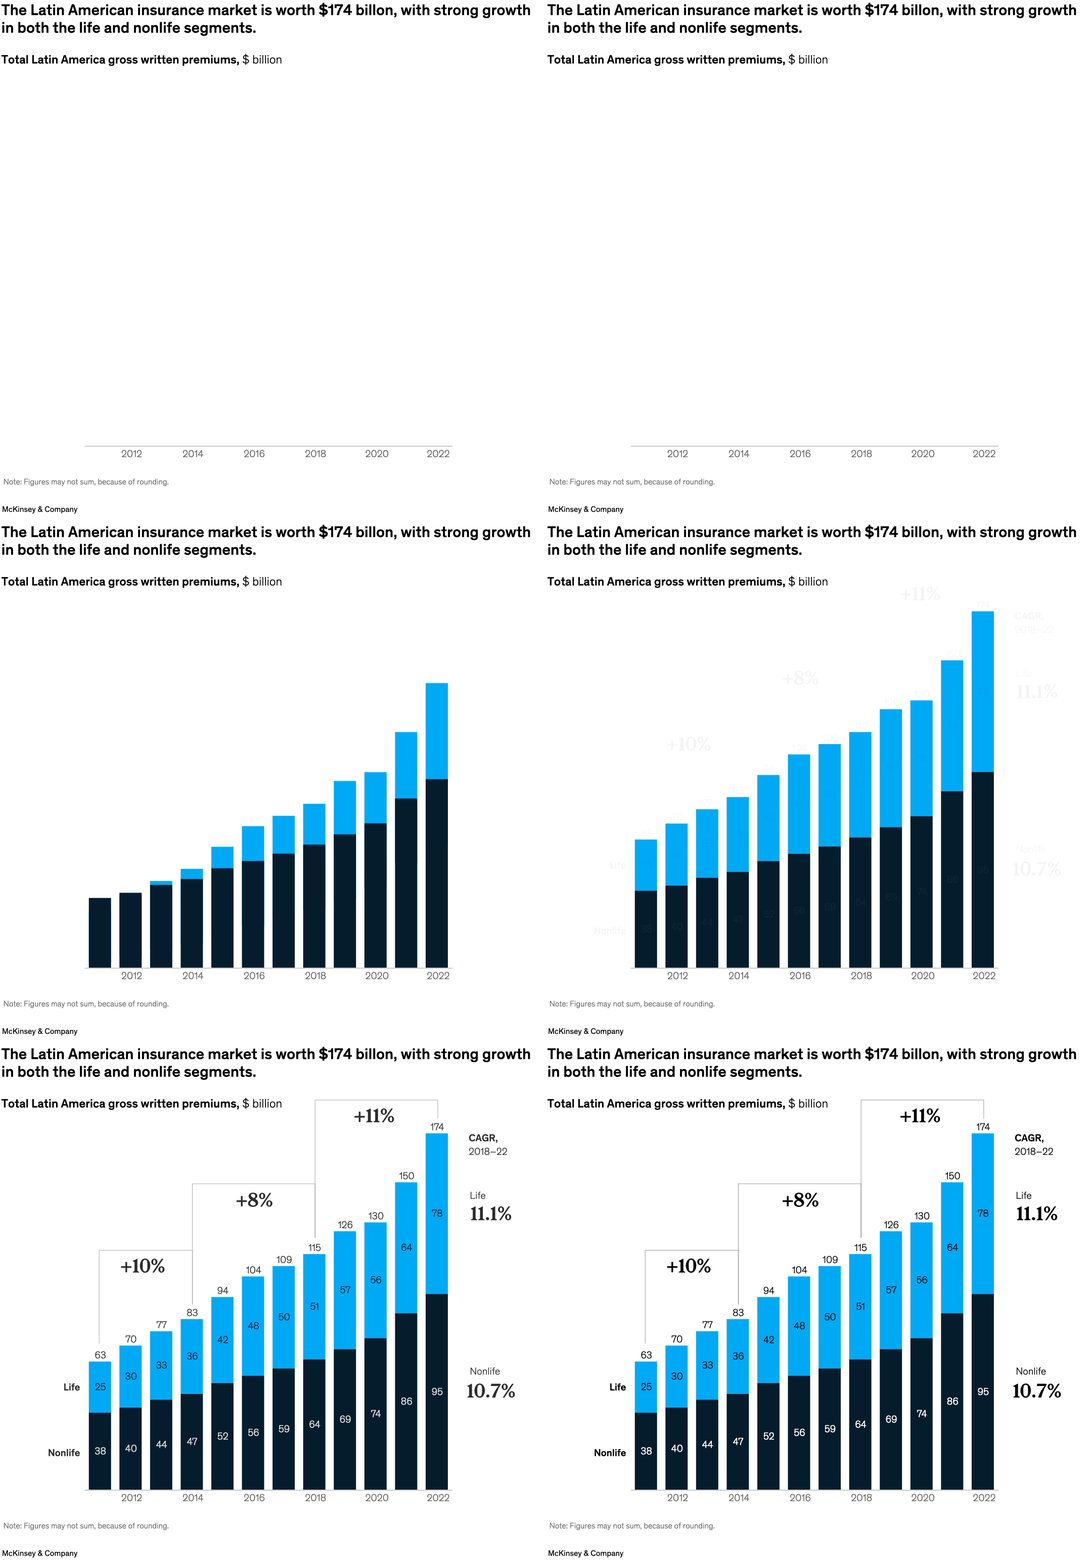
October 19, 2023 – Rapidly expanding economies and an emerging middle class have helped make Latin America a booming region for insurers, note senior partner Sergio Waisser and coauthors. In 2022, the insurance market for the region reached $174 billion. From 2011 to 2022, the Latin American nonlife insurance segment more than doubled, and the life insurance segment more than tripled.
To read the report, see “Global Insurance Report 2023: Capturing growth in Latin America,” September 22, 2023.
customizer here
Visual form
Stacked column chart.
Layout / body structure
The chart is a single time-series chart that reads left to right from 2011 to 2022, with each annual column split into nonlife at the bottom and life at the top, and CAGR callouts placed above the main growth intervals and at the right edge.
What is being compared
It compares total Latin America gross written premiums over time and shows how the total is divided between life and nonlife insurance segments.
Measurement system
The reader tracks dollar values in billions, using total labels above each column, segment labels inside the stacked blocks, and CAGR percentages for the highlighted time windows.
Visible structure inside the graphic
Each year is shown as one stacked vertical column, dark blocks represent nonlife, bright blue blocks represent life, brackets above the columns summarize growth periods, and the right-side notes isolate the 2018 to 2022 CAGR for both segments.
Main takeaway from the visual
The chart shows that the Latin American insurance market expanded strongly across the whole period, with both segments growing, but life insurance rising slightly faster than nonlife in the latest period.
Key standout values or extremes
Total premiums rise from 63 in 2011 to 174 in 2022, life increases from 25 to 78, nonlife increases from 38 to 95, and the chart marks life CAGR at 11.1 percent and nonlife CAGR at 10.7 percent from 2018 to 2022.
Controls / sequence, when applicable
This is a static chart image with no in-chart controls to operate.
Companion media, when applicable
There is no separate companion audio or video; the chart image is the full visual on this page.