Source page: McKinsey & Company
Commentary
A broken ladder?
Education
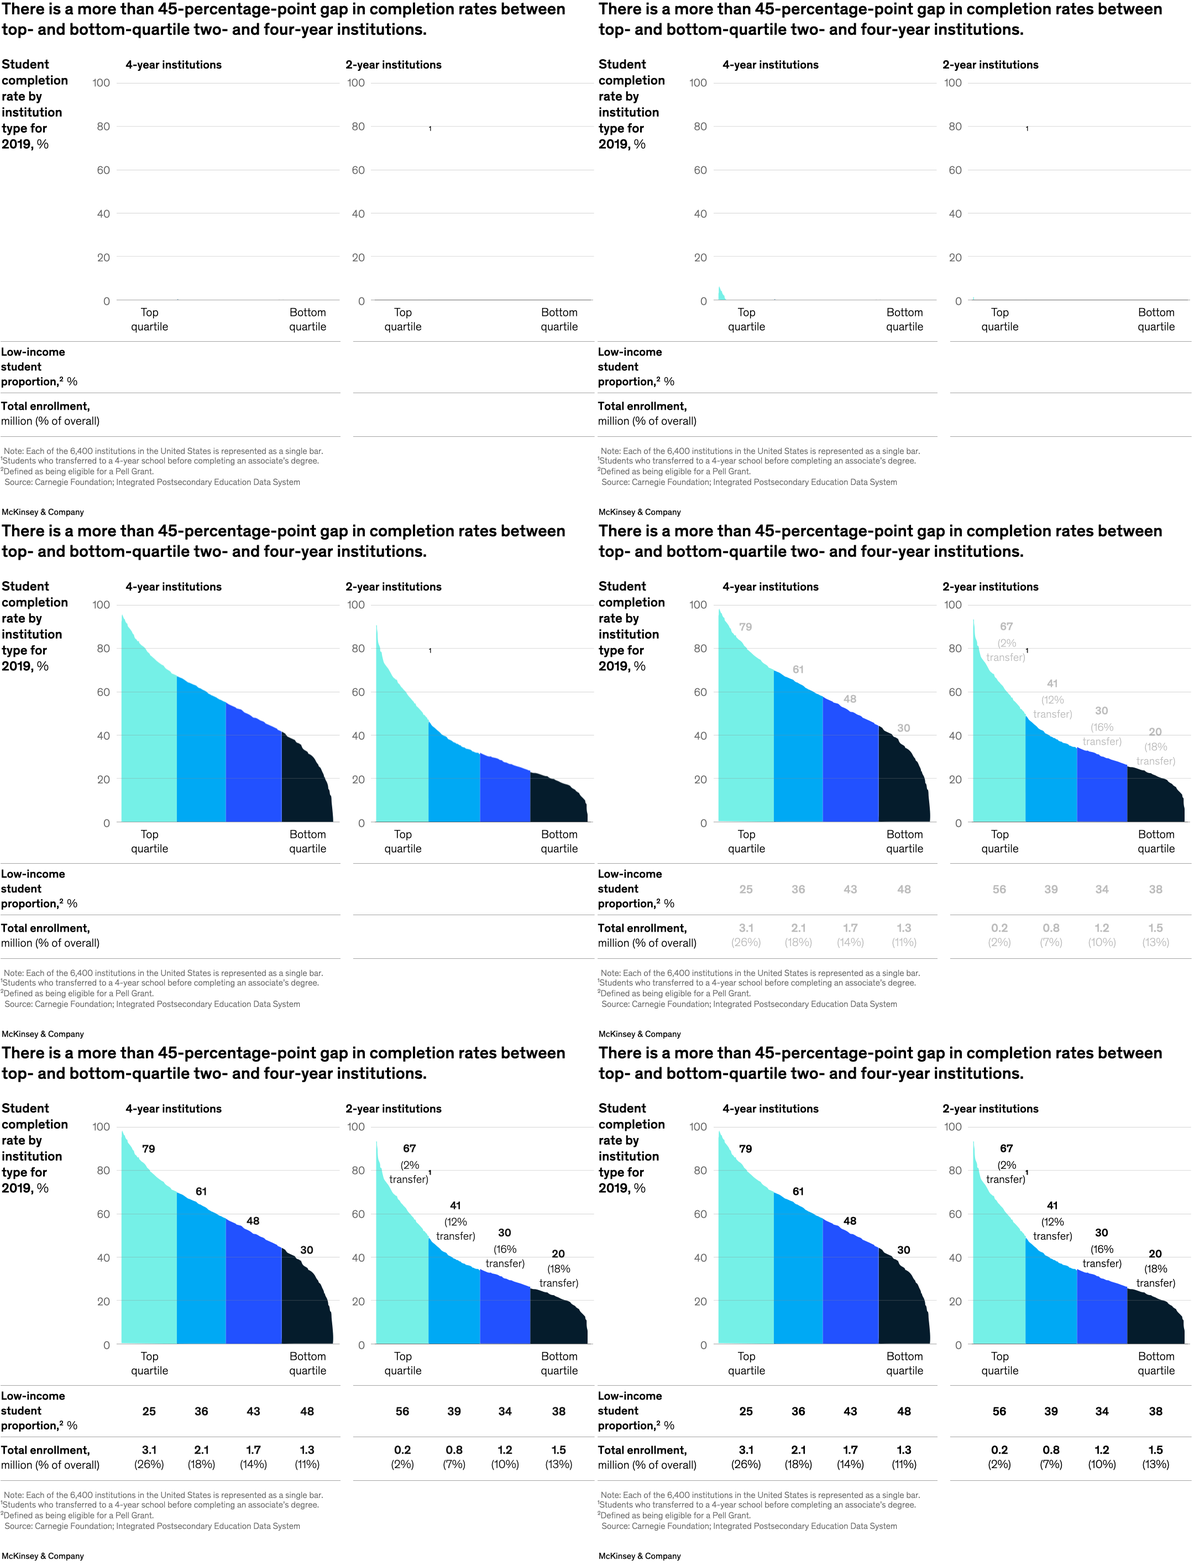
April 28, 2023 – The US higher education system is increasingly failing to deliver on its promise of fostering economic mobility and equity, as enrollment slows, student debt surges, and the sector’s reputation declines. Senior partner Jonathan Law and colleagues find that higher education could graduate ten million more students than currently projected over the next 20 years by taking steps such as narrowing the large gap in completion rates between high- and low-performing two-year and four-year institutions.
To read the report, “Fulfilling the potential of US higher education,” April 17, 2023.
customizer here
Visual form
Two-panel institutional completion-rate distribution chart.
Layout / body structure
The chart is split into a left panel for four-year institutions and a right panel for two-year institutions, with each panel read from the top quartile on the left side of the shape toward the bottom quartile on the right and a data table running underneath.
What is being compared
It compares student completion rates across institution quartiles for both four-year and two-year institutions, and then aligns those quartiles with low-income-student share and enrollment volume below.
Measurement system
The vertical measure is 2019 student completion rate in percent, and the bottom table adds low-income-student proportion in percent plus total enrollment in millions and share of overall enrollment.
Visible structure inside the graphic
Each panel uses a descending filled shape divided into colored quartile blocks, with benchmark numbers printed across the quartiles; underneath, the table rows line up with those same quartiles so the reader can connect performance, student mix, and scale.
Main takeaway from the visual
Completion rates fall sharply from top-quartile to bottom-quartile institutions in both sectors, and the side-by-side format makes the gap visible for two-year schools as well as four-year schools rather than leaving it as a single-system average.
Key standout values or extremes
For four-year institutions, the visible quartile markers run from 79 at the top quartile down to 30 at the bottom; for two-year institutions they run from 67 down to 20, producing more than a 45-percentage-point gap in each panel.
Controls / sequence, when applicable
This is a static chart image with no in-chart controls to operate.
Companion media, when applicable
There is no separate companion audio or video; the chart image is the full visual on this page.