Source page: McKinsey & Company
Commentary
A dearth of BLNA women in tech
Diversity & Inclusion | Technology
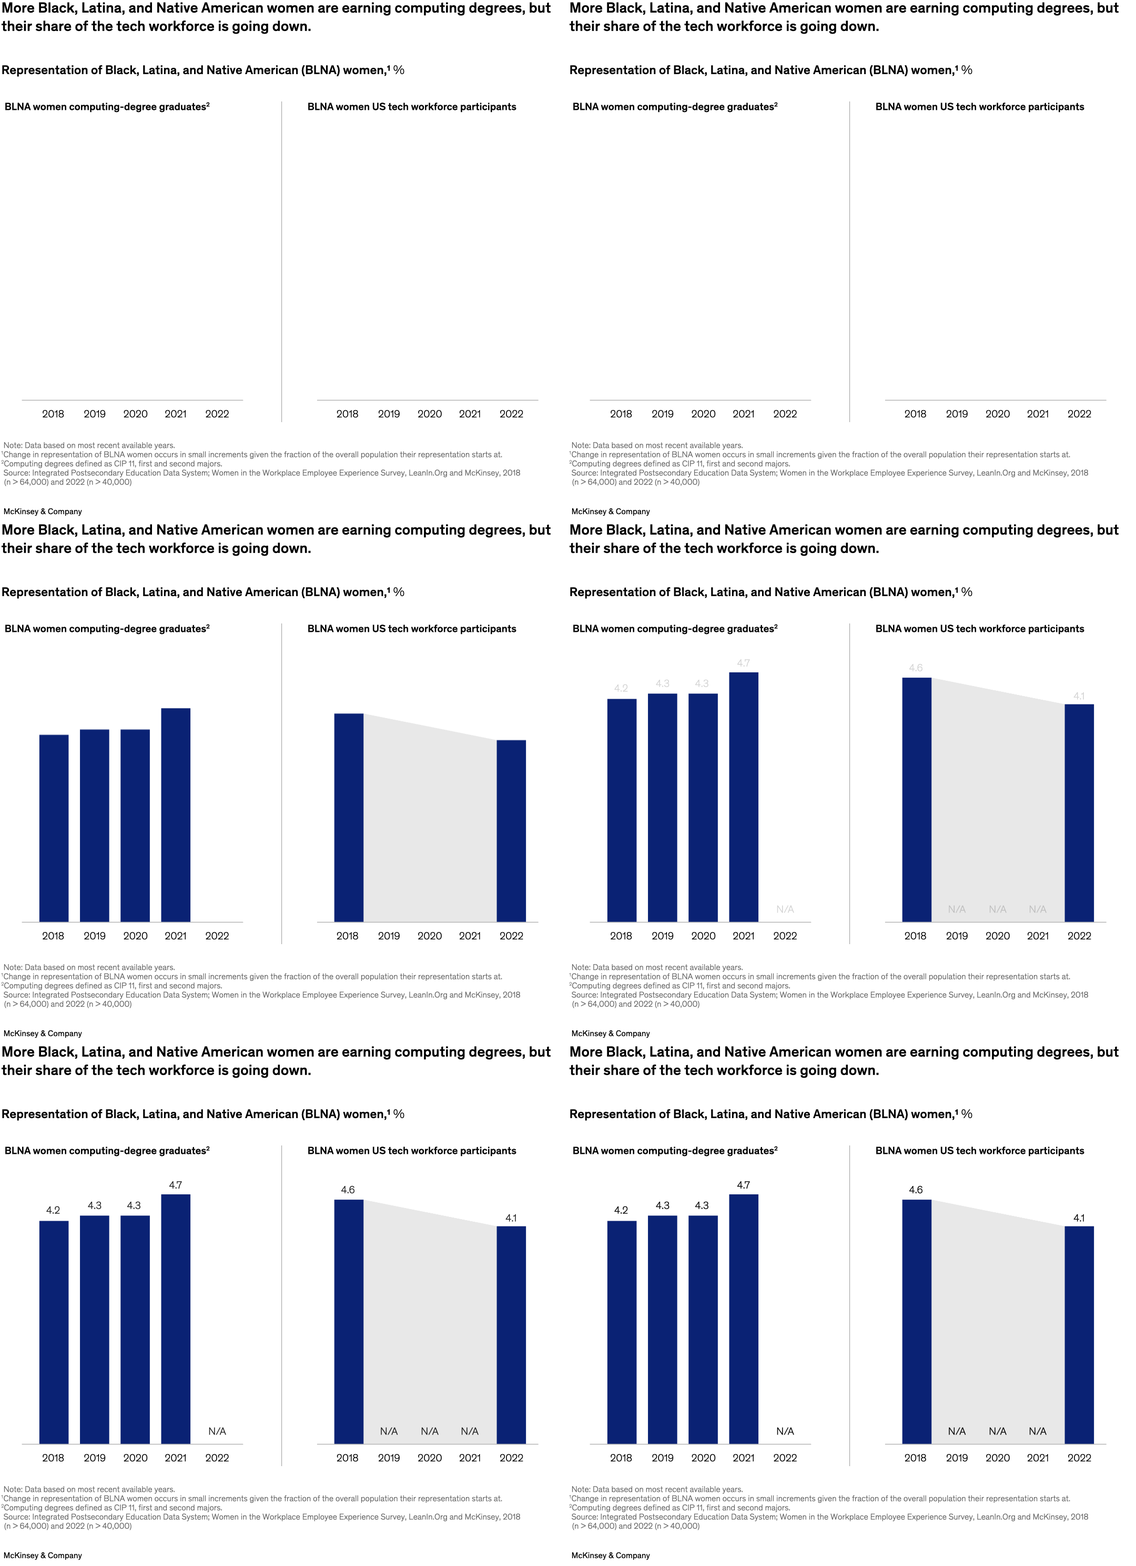
September 19, 2023 – The number of computing degrees awarded to Black, Latina, and Native American (BLNA) women nearly doubled from 2016 to 2021. Yet representation of BLNA women in tech roles has steadily declined by more than 10 percent in the past four years, senior partner Tiffany Burns and coauthors note. Current policies and practices haven’t helped Black, Latina, and Native American women in tech as much as they could, and approximately 40 percent of BLNA women report experiencing prejudice related to gender or race at work, our analysis finds.
To read the report, see “Empowering Black, Latina, and Native American women in tech,” August 29, 2023.
customizer here
Visual form
Two-panel comparison chart. It places an education pipeline view beside a workforce-participation view.
Layout / body structure
The chart is split into two side-by-side panels: BLNA women computing-degree graduates on the left and BLNA women in the US tech workforce on the right. Both panels run across recent years so the reader can compare the two trajectories directly.
What is being compared
It compares the growth in computing-degree attainment for Black, Latina, and Native American women with their declining representation in tech workforce participation.
Measurement system
The measures are percentage shares rather than raw head counts, and the x-axis moves through the recent multi-year period. The point is the direction of representation in two related but different pipelines.
Visible structure inside the graphic
The chart uses mirrored panels with the same time orientation so the reader can see the education pipeline strengthening while workforce representation weakens. The split layout is what makes the contradiction visible.
Main takeaway from the visual
The education pipeline is improving, but that improvement is not translating into workforce representation. The two-panel structure is explicitly built to show that the lines move in opposite directions.
Key standout values or extremes
The title carries the core extreme: more BLNA women are earning computing degrees even as their share of the tech workforce goes down. The most important visual contrast is therefore the positive slope on the left versus the weaker or declining slope on the right.
Controls / sequence, when applicable
This is a static chart image with no in-chart controls to operate.
Companion media, when applicable
There is no separate companion audio or video; the chart image is the full visual on this page.