Source page: McKinsey & Company
Commentary
A new high for low-emissions cars
Mobility | Decarbonization | Climate change
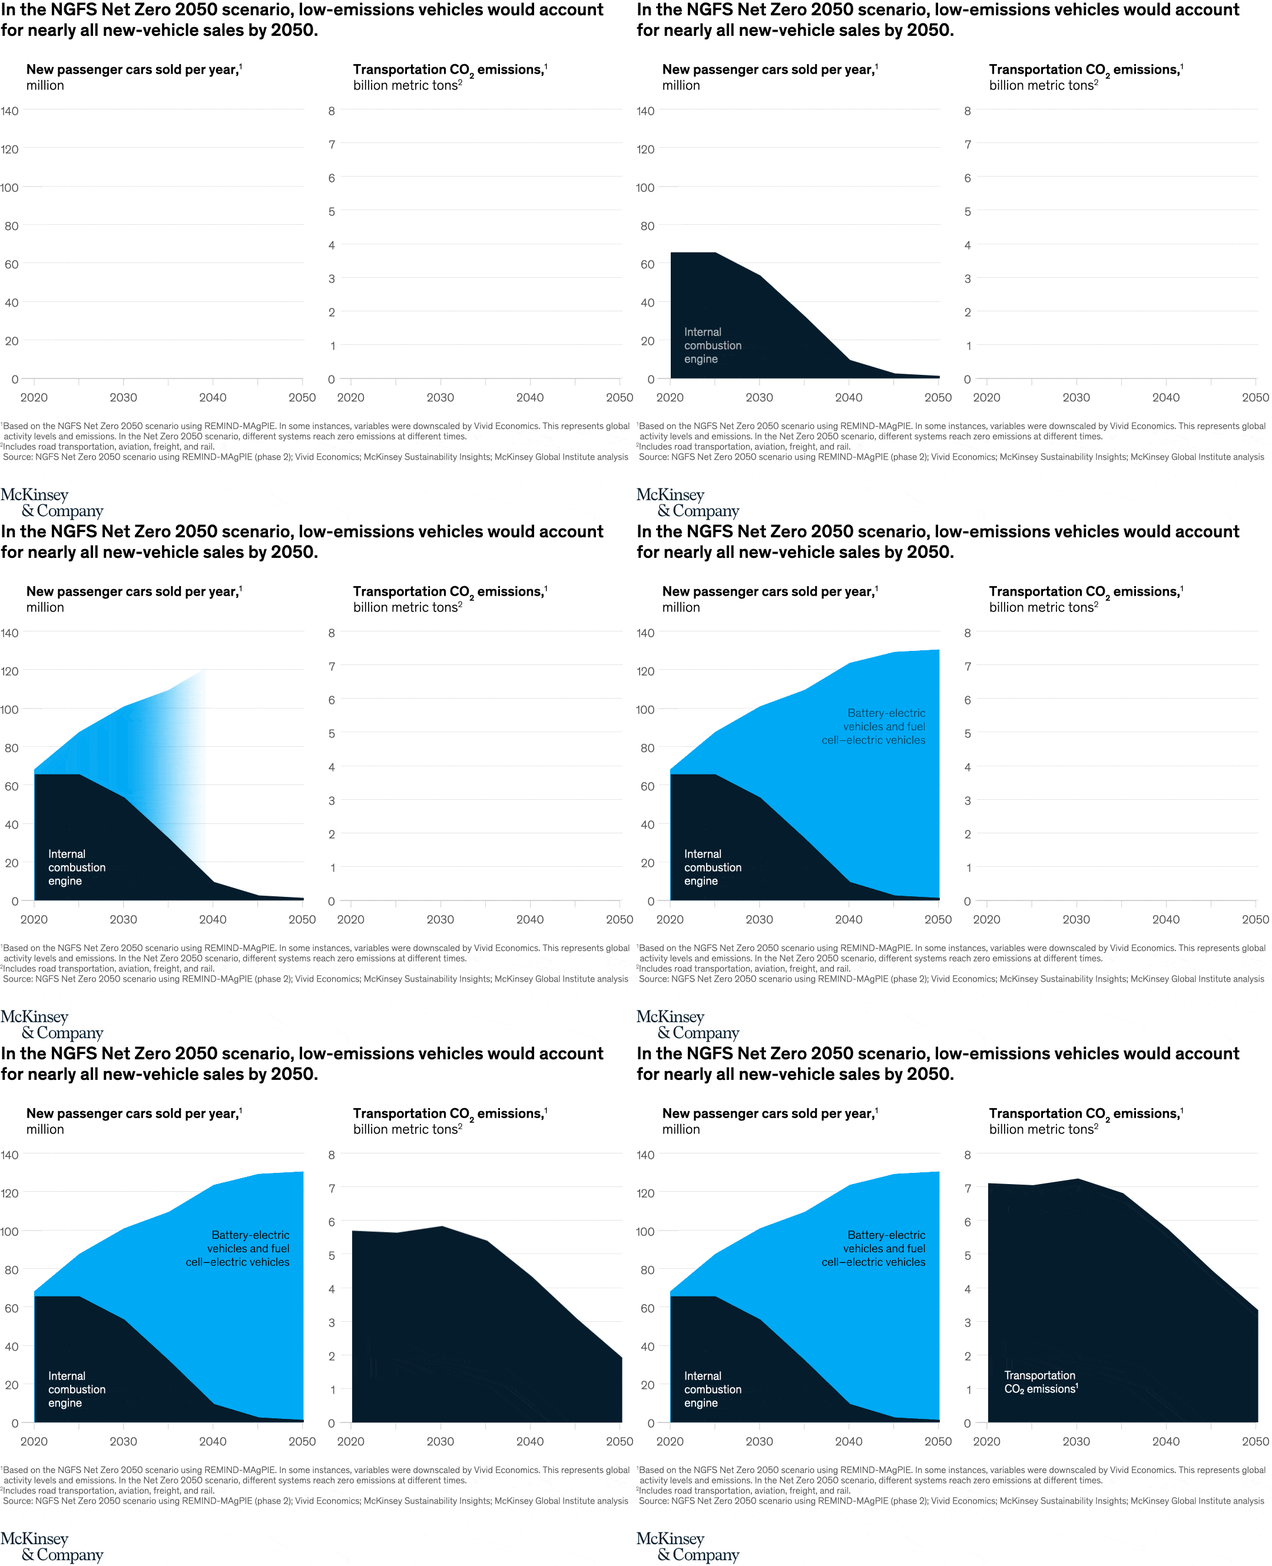
May 31, 2022 – To keep postindustrial warming below 1.5°C by the end of the century, new-car sales of low-emission vehicles will need to increase from today’s sales figures of 5 percent to almost 100 percent by 2050. That would serve to cut transportation CO2 emissions almost in half.
To read the article, see “Mobility’s net-zero transition: A look at opportunities and risks,” April 25, 2022.
customizer here
Visual form
Two-panel area chart.
Layout / body structure
The chart places two aligned panels side by side. Read the left panel first to see the split in new-car sales by powertrain over time, then read the right panel to see how transportation CO2 emissions change over the same 2020-to-2050 horizon.
What is being compared
The left panel compares internal-combustion-engine sales with battery-electric and fuel-cell vehicle sales in the NGFS Net Zero 2050 scenario. The right panel compares transportation CO2 emissions over the same timeline, so the page links the shift in vehicle mix to the decline in emissions.
Measurement system
The left panel is measured in millions of new passenger cars sold per year, and the right panel is measured in billions of metric tons of transportation CO2 emissions. Both panels use calendar years along the horizontal axis, with major anchors at 2020, 2030, 2040, and 2050.
Visible structure inside the graphic
On the left, a dark area for internal-combustion-engine vehicles shrinks while a bright blue area for battery-electric and fuel-cell vehicles expands and overtakes it. On the right, one dark area rises slightly around 2030 and then slopes sharply downward through 2050, creating a clean before-and-after contrast between adoption and emissions.
Main takeaway from the visual
The chart shows a near-complete turnover in new-vehicle sales by 2050, with low-emissions vehicles taking almost the entire sales mix as internal-combustion sales collapse. At the same time, transportation emissions move from a roughly flat early path to a pronounced decline, so the visual ties electrification directly to lower sector emissions.
Key standout values or extremes
Total new-car sales rise from roughly 68 million in 2020 to about 130 million by 2050, but the composition flips from almost entirely combustion to almost entirely low-emissions vehicles. Transportation CO2 emissions sit a little above 7 billion metric tons around 2020 to 2030 and then fall to roughly 3.3 billion metric tons by 2050.
Controls / sequence, when applicable
This is a static chart image with no in-chart controls to operate.
Companion media, when applicable
There is no separate companion audio or video; the chart image is the full visual on this page.