Source page: McKinsey & Company
Commentary
A quantum leap for the planet?
Sustainability | Climate change | Technology
July 5, 2022 – Meeting net-zero goals won’t be possible without huge advances in climate technology. That’s where quantum computing could help. Quantum computing could address thorny sustainability problems such as curbing methane produced by agriculture, making the production of cement emissions-free, and improving electric batteries for vehicles. In all, quantum impacts could help put the world back on track to becoming net zero by 2050.
To read the article, see “Quantum computing just might save the planet,” May 19, 2022.
customizer here
Visual form
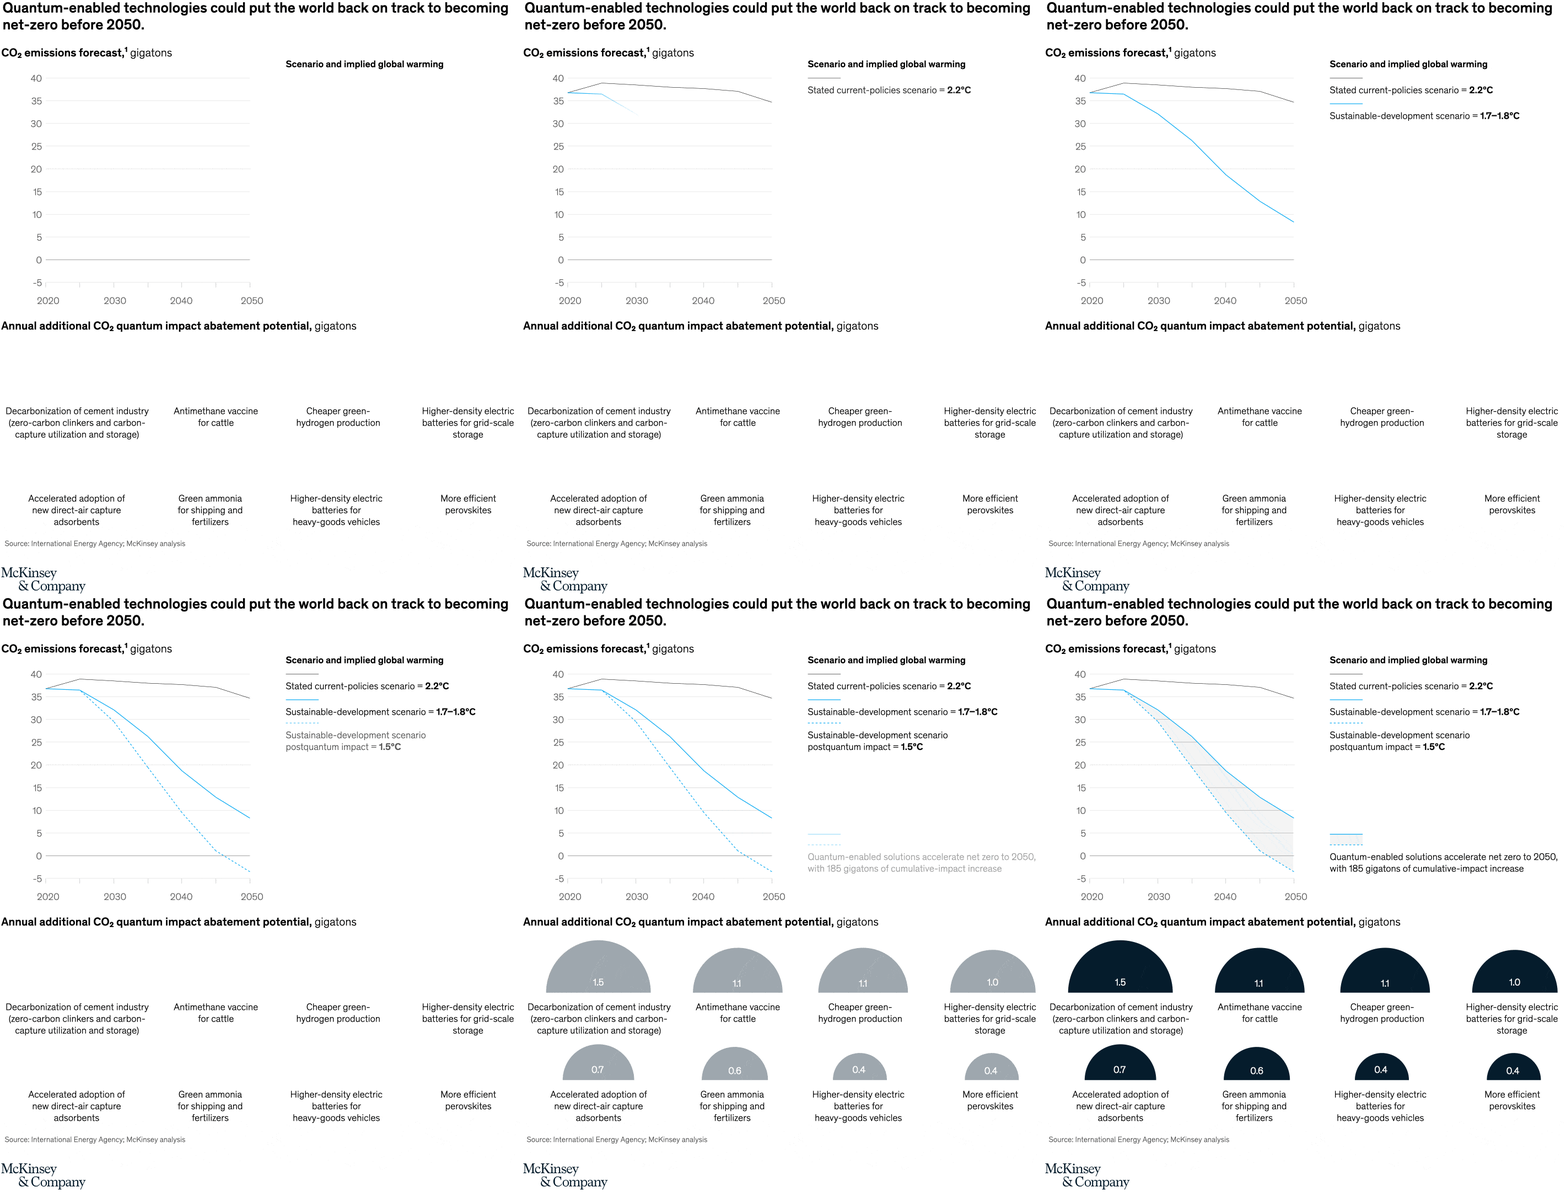
Scenario line chart paired with a row of solution icons.
Layout / body structure
The top half of the chart is a scenario chart read left to right from the present toward 2050, while the bottom half is a row of seven semicircle icons for quantum-enabled use cases. Reader first sees the emissions trajectories and then drops down to the individual solution areas that contribute to the abatement potential.
What is being compared
The chart compares several climate scenarios: a stated current-policy path, a sustainable development path, and a sustainable development path with additional population impact. It sets those trajectories against the annual additional CO₂ quantum impact abatement potential represented by the solution icons below.
Measurement system
The vertical axis is CO₂ emissions forecast in gigatons, and the horizontal axis runs toward 2050. The lower row translates additional annual quantum impact abatement potential into gigaton-equivalent semicircle values for each solution area.
Visible structure inside the graphic
At the top, one gray line stays relatively high while the blue scenario lines bend sharply downward toward much lower emissions levels. Along the bottom, seven gray semicircle markers represent application areas such as decarbonization of cement, architecture for cattle, cheaper green-hydrogen production, higher-density batteries, accelerated electric-aircraft adoption, green-ammonia fertilizers, and more efficient perovskites.
Main takeaway from the visual
The chart shows quantum-enabled climate solutions as a downward force on the emissions trajectory rather than as a standalone technology story. The visual argument is that these use cases could help pull the world much closer to the lower-emissions pathways by 2050.
Key standout values or extremes
The top chart begins near 40 gigatons and shows the lower blue pathways falling toward much smaller values by 2050. In the bottom row, the visible solution markers include semicircle labels such as 0.4, 0.6, 0.7, and 0.8 gigatons, indicating that no single use case dominates the whole total on its own.
Controls / sequence, when applicable
This is a static chart image with no in-chart controls to operate.
Companion media, when applicable
There is no separate companion audio or video; the chart image is the full visual on this page.