Source page: McKinsey & Company
Commentary
A run on recycled materials
Sustainability | Consumer
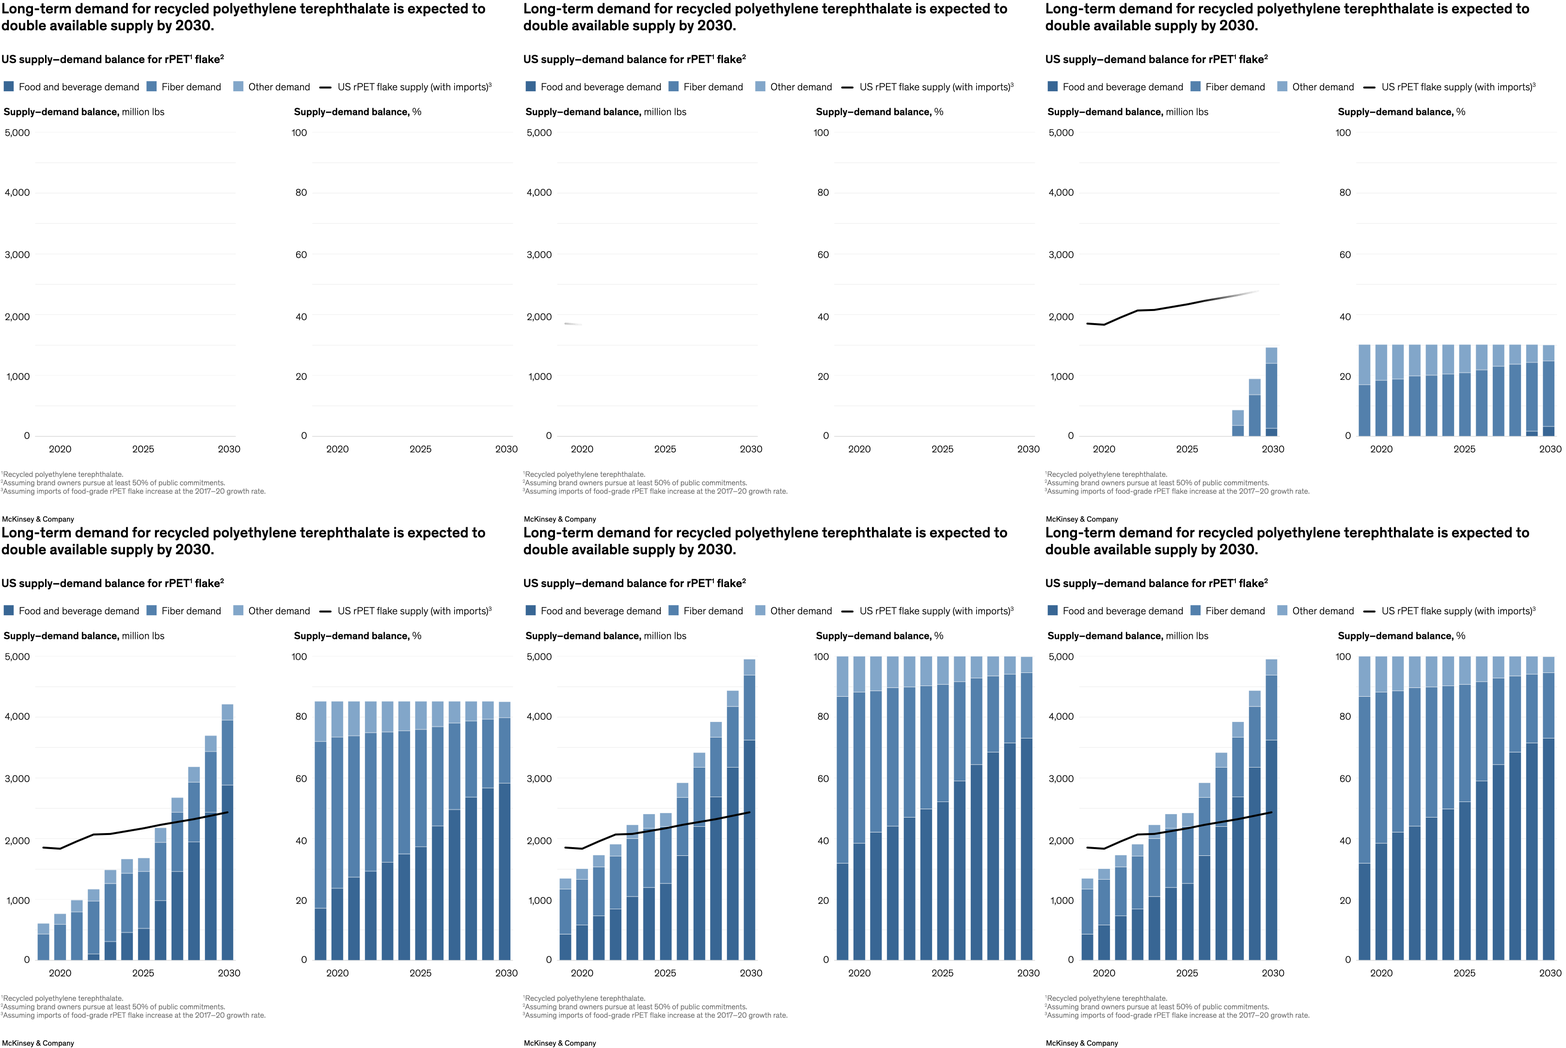
October 10, 2023 – Only 18 percent of polyethylene terephthalate (PET) bottle waste is recycled across the US value chain, note senior partners David Feber and Yasir Mirza and colleagues. At the same time, brand owners and the packaging industry are looking to increase the amount of recycled content in their products to meet sustainability commitments. There may be opportunities for packaging industry players, as increasing demand for recycled PET will outpace supply by 2030.
To read the article, see “Filling the gap: Boosting supply of recycled materials for packaging,” September 5, 2023.
customizer here
Visual form
Two-panel supply-and-demand balance chart that combines stacked demand blocks with a supply line. It reads as a forward-looking market-gap chart.
Layout / body structure
The page places two panels side by side: the left panel shows supply-demand balance in million pounds, and the right panel shows the same balance in percentage terms. Both panels move across the years 2020, 2025, and 2030.
What is being compared
It compares US rPET flake supply with demand from food and beverage, fiber, and other end uses, showing how those demand streams stack against available supply over time.
Measurement system
The left panel uses million pounds, the right panel uses percentage supply-demand balance, and a black line marks US rPET flake supply including imports. Color separates the three demand categories.
Visible structure inside the graphic
The stacked demand blocks rise over time while the supply line traces a separate path across the same years. The second panel mirrors the same story in percentage terms, so the reader gets both absolute scale and relative shortfall in one chart.
Main takeaway from the visual
Demand rises faster than supply, so the gap widens as the chart approaches 2030. The visual is built to show a shortage problem, not a balanced market, with the combined demand stack pulling away from the supply line.
Key standout values or extremes
The title carries the key extreme: long-term demand is expected to double available supply by 2030. The most important visual contrast is therefore the clear separation between the 2030 demand stack and the lower supply line in both panels.
Controls / sequence, when applicable
This is a static chart image with no in-chart controls to operate.
Companion media, when applicable
There is no separate companion audio or video; the chart image is the full visual on this page.