Source page: McKinsey & Company
Commentary
A shortfall in disability data
Healthcare | Inequality
September 29, 2023 – Sixteen percent of the global population lives with significant disabilities, and many of these people experience greater barriers to healthcare access. Yet, a significant portion of countries collect no data on this population, leaving gaps in healthcare equity, partner Sunny Sun and coauthors explain in a report with the Missing Billion Initiative. Closing this gap, they note, requires countries to improve not only their data collection practices but also the updates to those data sets.
To read the report, see “The missing billion: Lack of disability data impedes healthcare equity,” September 12, 2023.
customizer here
Visual form
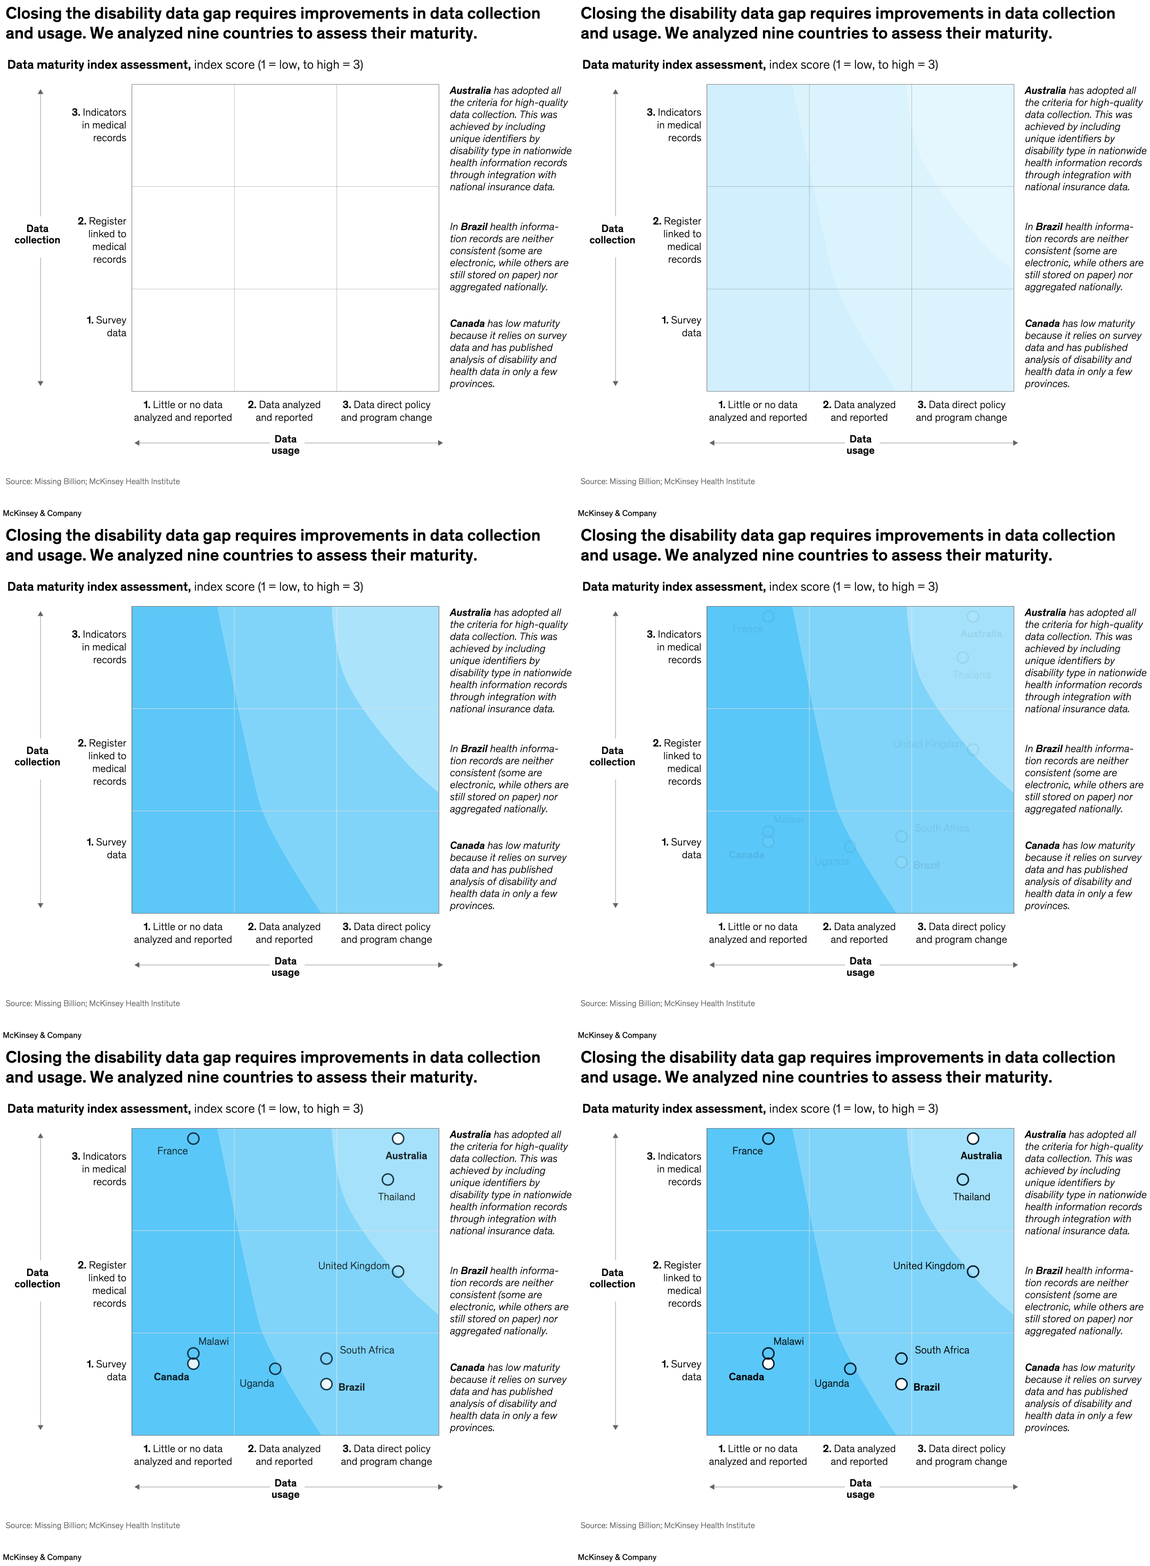
Maturity matrix. It maps countries into a grid defined by data collection and data usage.
Layout / body structure
The chart is laid out as a square matrix with data collection on one axis and data usage on the other, and country callouts positioned inside or beside the relevant cells. Reader scans diagonally from the weakest lower-left corner toward the strongest upper-right corner.
What is being compared
It compares the disability-data maturity of the countries in the study, showing how far each one has progressed in collecting disability data and then using it for reporting, policy, and program change.
Measurement system
Both axes use a maturity scale from 1 to 3, where 1 is low and 3 is high. The chart is categorical and diagnostic rather than numeric in dollars or percentages.
Visible structure inside the graphic
The matrix is divided into labeled maturity bands, with country annotations and short explanatory notes placed in the relevant areas. This structure makes the chart part scorecard and part landscape map of national capability.
Main takeaway from the visual
The gap is not just about missing data collection; it is also about limited data use. The countries spread unevenly across the matrix, showing that a nation can be weak in collection, weak in usage, or lag on both dimensions at once.
Key standout values or extremes
Australia is called out as having adopted all the criteria for high-quality data collection and sits near the strongest end of the grid. Brazil and Canada are used as contrasting examples of lower maturity, reinforcing the unevenness of the landscape.
Controls / sequence, when applicable
This is a static chart image with no in-chart controls to operate.
Companion media, when applicable
There is no separate companion audio or video; the chart image is the full visual on this page.